On-chain data shows the small Bitcoin holders have deepened their selloff recently, while the largest of investors have been ramping up their buying.
Bitcoin Accumulation Trend Score Shows Divergence Forming Among Holders
In a new post on X, the on-chain analytics firm Glassnode has discussed the latest trend in the Accumulation Trend Score for the various Bitcoin holder cohorts.
The Accumulation Trend Score is an indicator that basically tells us about whether BTC investors are accumulating or distributing. The indicator calculates its value not just by keeping track of the balance changes taking place in the wallets of the investors, but also by accounting for the size of the addresses.
When the metric’s value is greater than 0.5, it suggests that large investors (or alternatively, a large number of small investors) are buying. The closer the indicator is to the 1 mark, the stronger is this behavior.
On the other hand, the score being below 0.5 means the market is going through a potential phase of distribution. In this case, the extreme point lies at a value of zero.
In the context of the current topic, the version of the Accumulation Trend Score that’s of interest isn’t the one for the combined network, but rather the one that tracks the behavior separately for the various investor groups.
Addresses or holders have been divided into these cohorts on the basis of wallet size. Here is how the Accumulation Trend Score has changed for each of the groups over the past year:
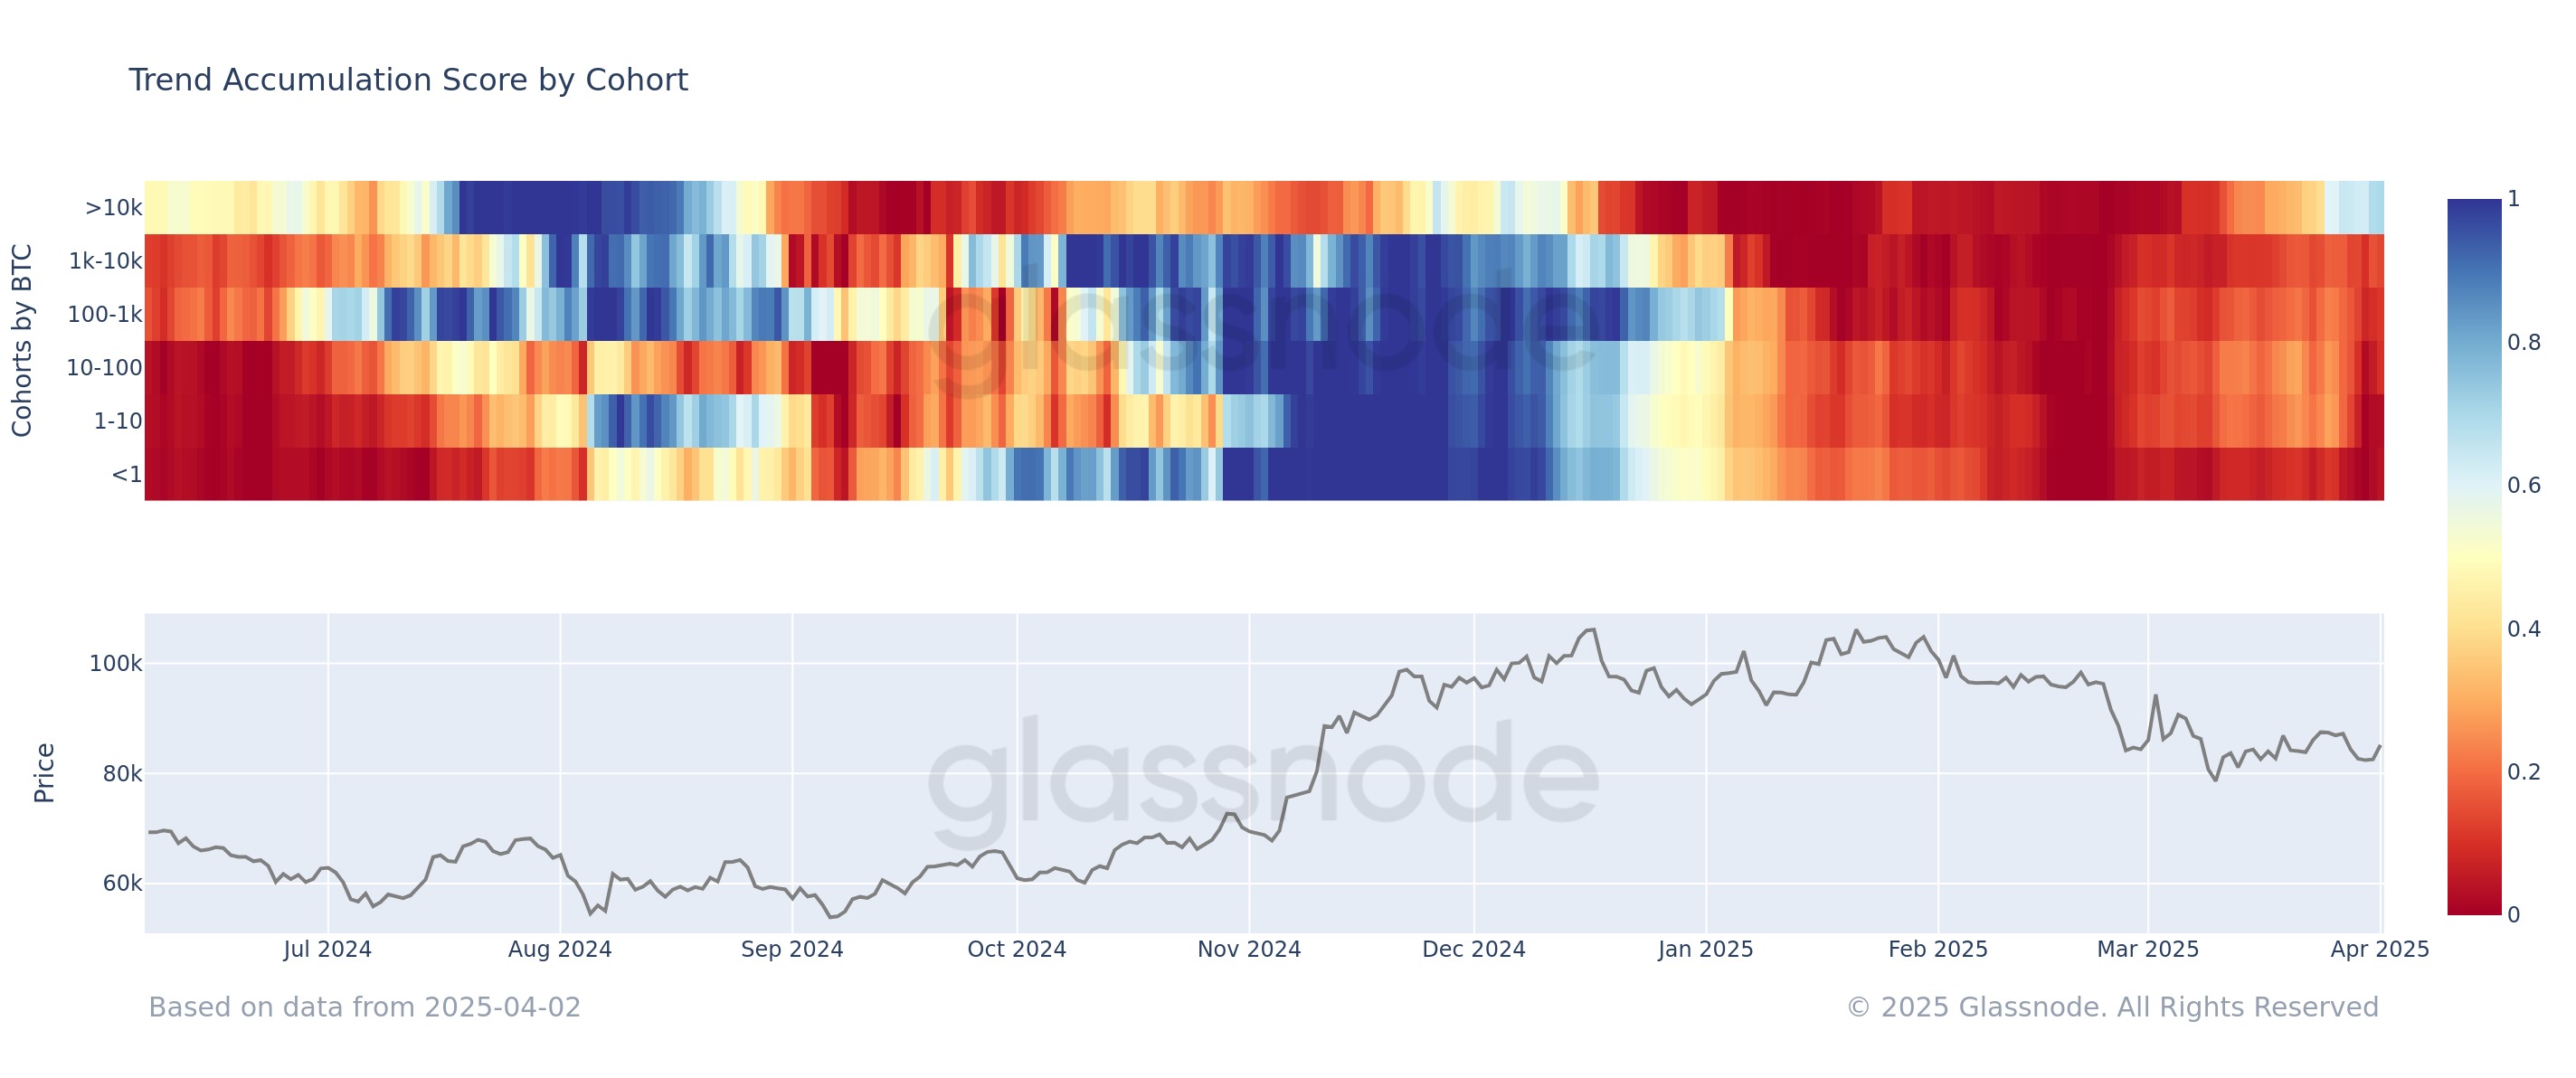
As displayed in the above graph, the Bitcoin Accumulation Trend Score saw a value close to the 1 level for most of the investor groups between November and January, implying strong accumulation was occurring. Alongside this buying, BTC enjoyed its bull run beyond the $100,000 level.
With the start of this year, though, a shift to selling took place, with the indicator achieving a value close to zero for all the cohorts in February. Naturally, the cryptocurrency saw a bearish reversal as a result of this distribution.
March saw the investors pull back a bit on their selling, but the net situation in the sector remained firmly that of distribution. From the chart, it’s visible that the holder behavior has been nearly uniform for most of the year so far, but recently, a divergence has become prominent.
Holders with less than 1 BTC, popularly known as retail investors, have deepened their distribution again, with the metric dropping under 0.2. On the other hand, investors on the exact opposite end of the spectrum, the largest of entities with more than 10,000 BTC, have shifted focus to accumulation, with the score nearing 0.6.
When bullish pressure started letting off for Bitcoin earlier, these ‘mega whales‘ were the first to start participating in a strong selloff. With this smart-money cohort now once again doing something different from the rest of the market, it’s possible that another trend shift may be ahead for the asset.
BTC Price
Bitcoin has opened April with some recovery as its price has gone up to the $84,900 level.


