Menu

Categories:

Hot right now:

Follow on:

Coinsurges provides coverage of fintech, blockchain, and Bitcoin, delivering the most recent news and analyses on the future of money. Stay up-to-date with live prices, charts, and trading options for the top exchanges. Keep track of the day's top cryptocurrency gainers and losers, as well as which coins have experienced gains and losses in the past 24 hours.
Trust Coinsurges as your go-to source for all news and updates in the industry.

Will Bitcoin Crash Again? Bearish Pattern Spotted

Share This Post

Why Bitcoin Price is Down Today?

The post Will Bitcoin Crash Again? Bearish Pattern Spotted appeared first on Coinpedia Fintech News

Amid the ongoing tariff war, Bitcoin (BTC), the world’s largest cryptocurrency by market cap, is poised for a massive price crash due to its bearish price action. In recent days, BTC appears to be consolidating within a tight range. However, upon closer examination, it seems to have formed a bearish head and shoulders pattern on the four-hour time frame.

Current Price Momentum 

It seems like the market isn’t reacting to any positive news. Earlier, following Treasury Secretary Scott Bessent’s bold statement, BTC along with major assets began to rebound, but the upside momentum later faded and all gains were lost. Currently, BTC is trading near the $82,500 level and has recorded a price decline of over 1.10% in the past 24 hours. During the same period, its trading volume dropped by 50%, indicating lower participation from traders and investors due to notable market volatility.

Bitcoin (BTC) Technical Analysis and Upcoming Levels 

According to expert technical analysis, with the recent price decline, BTC is heading toward the neckline of the bearish head and shoulders pattern.

Source: Trading View

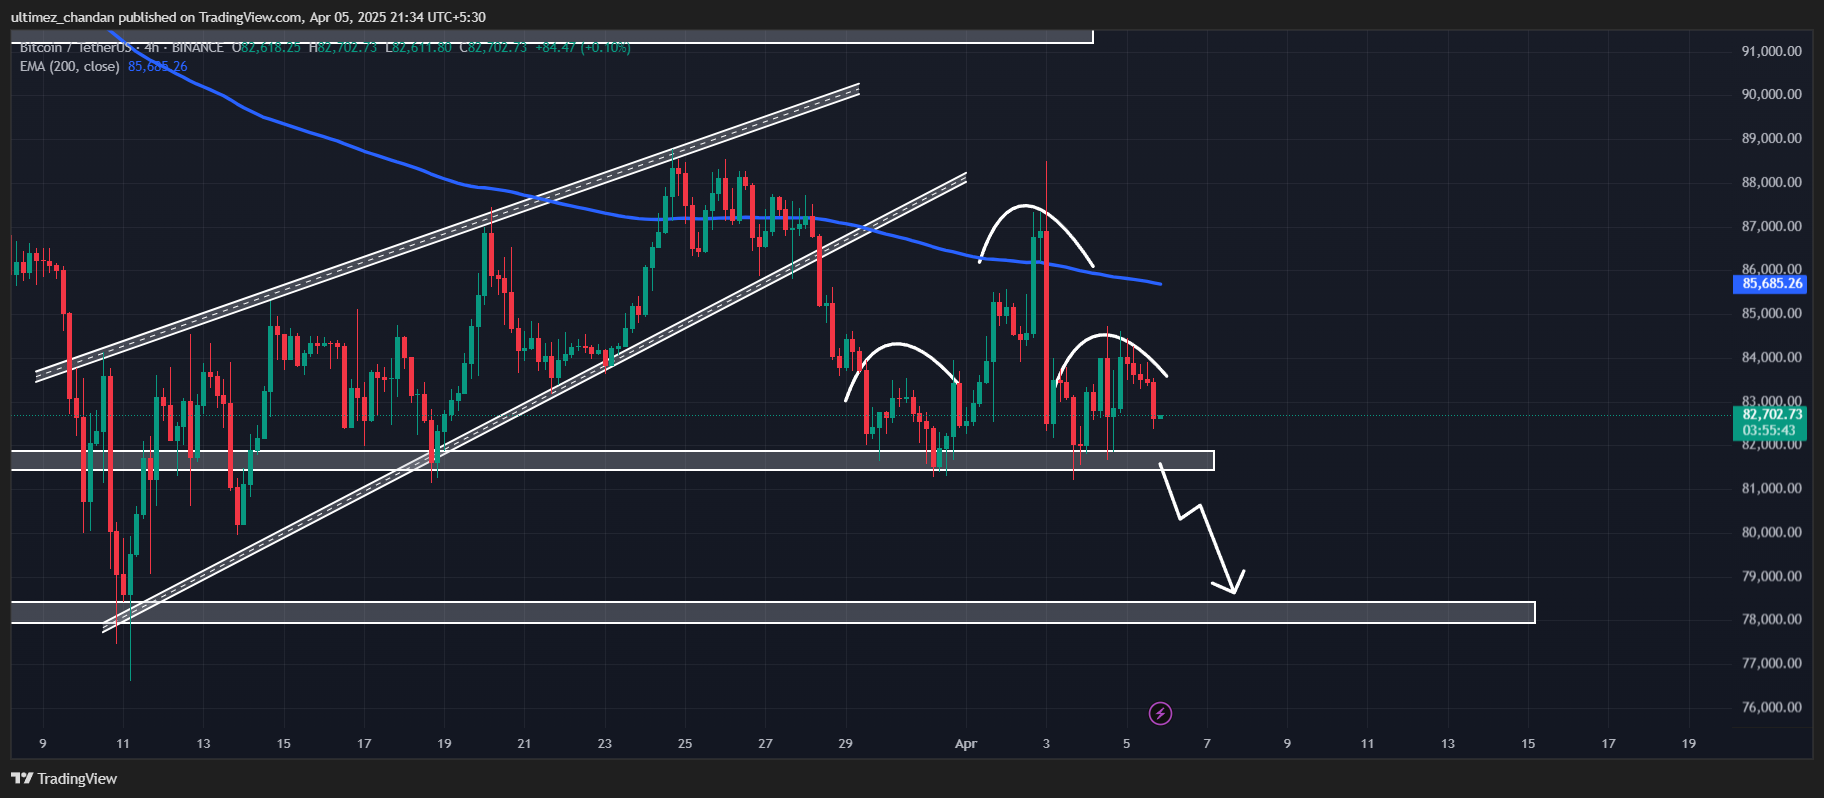
Based on recent price action and historical patterns, if this momentum continues and BTC breaches the neckline at the $81,500 level, there is a strong possibility it could decline by 4% to reach the $78,200 level in the near future.

As of now, the asset is trading below the 200 Exponential Moving Average (EMA) on both the daily and four-hour time frames, indicating a strong downtrend and weak momentum.

Traders typically wait for a price jump to short the asset, which explains the recent price spike and subsequent drop within less than 24 hours.

$175 Million Worth of BTC Outflow 

Despite the bearish outlook, investors and long-term holders seem to be accumulating the asset, as reported by the on-chain analytics firm Coinglass.

Source: Coinglass

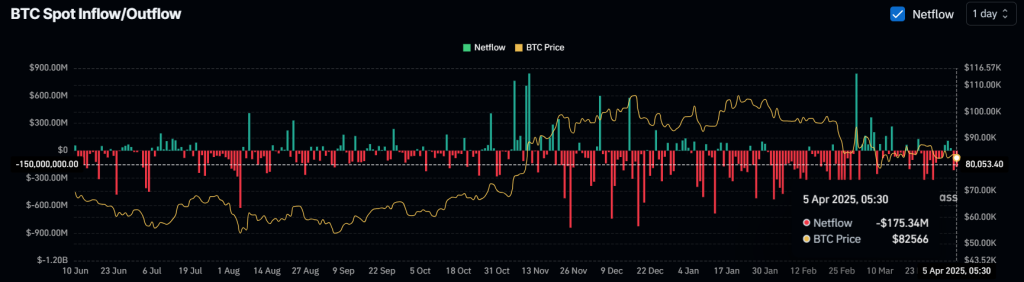
Data from spot inflow/outflow reveals that exchanges have witnessed an outflow of approximately $175 million worth of BTC over the past 24 hours. Such outflow during a bearish market sentiment suggests potential accumulation.

While this can create buying pressure and trigger an upside rally, it typically occurs during a bull run.

Read Entire Article
spot_img
- Advertisement -spot_img

Related Posts

Solana At A Crossroads: Consolidation Before The Next Major Surge?

In a recent update on X, analyst GemXBT highlighted that Solana (SOL) is moving within a consolidation phase, with the price hovering near the $147 level The pattern indicates that SOL is coiling up,

Robert Kiyosaki Warns Global Panic Is Spreading, the Crash Is Just Beginning

Robert Kiyosaki sounds the alarm on global panic, asking if bitcoin dropped to $300, would you cry or celebrate—urging action before the financial crash hits Robert Kiyosaki Sounds Alarm on

Bitcoin short term realized volatility drops to 16% after early April spike

Bitcoin’s volatility curve saw a sharp swing in April Realized volatility measures the actual day-to-day variability in Bitcoin’s price over a set window instead of the market’s

Solana Monthly Candle Reclaims Key Levels – Is $240 The Next Target?

Solana has held strong above the $145 level, maintaining a bullish structure despite recent market volatility However, bulls have failed to push decisively above the $155 resistance zone, a key level

Investors increase crypto allocations to yearly highs, Bitcoin leads the accumulation

Investor portfolio allocations to crypto have reached a yearly high of 18% as of April 29, according to a recent report published by CoinShares  The report attributed the increase to recent price

Fed Liquidity or Bust: Veteran Investor Sees Inflation Roaring Back to 9%

A Federal Reserve survey naming the trade war and US debt as the economy’s top threats has prompted veteran investor Clem Chambers to warn of an overlooked supply-chain squeeze that could jolt