Tony “The Bull” Severino has issued a cautionary reminder to the crypto community not to fall into the trap of comparing Bitcoin’s current cycle with its historic 2017 bull run. According to the technical analyst, a critical indicator on the monthly chart paints a very different picture from the one many investors hope for. Severino’s warning comes as Bitcoin continues to consolidate between $81,000 and $84,500, with the buying trend suggesting that it might be topping out.
Stochastic Oscillator Says Bitcoin No Longer In Same Phase As 2017
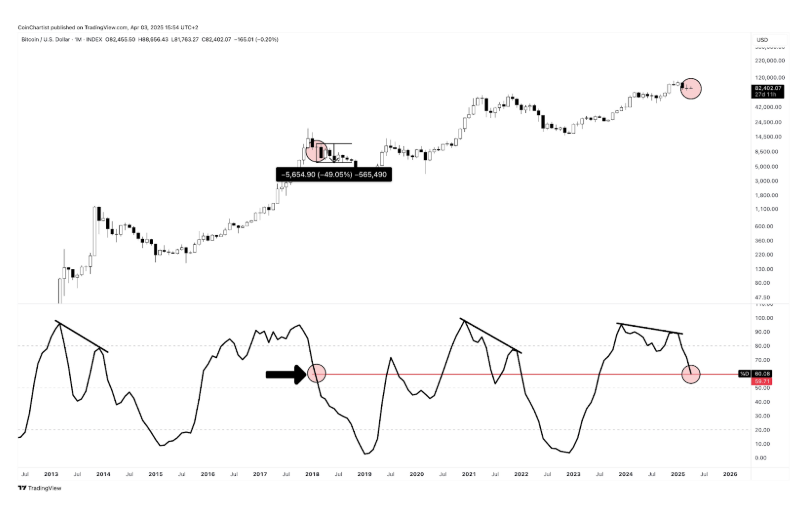
At the core of Severino’s argument is the stochastic oscillator, a momentum indicator commonly used by technical analysts to analyze whether a cryptocurrency is overbought or oversold relative to its recent price range. When applied to Bitcoin on the monthly candlestick timeframe, the oscillator offers a broader view of long-term momentum trends stretching back to 2013. In the chart shared by Severino, this timeframe includes every major bull and bear cycle, with many recurring patterns.
His outlook is in response to market participants who link the 1-month Bitcoin stochastic oscillator’s movement to its past levels in 2017 as a sign of what they expect in the current market. As seen in the chart below, the oscillator has been undergoing the same 2017 downtrend since the beginning of 2025. At the time of writing, the oscillator is sitting around 60, the same level it fell to during the correction in the 2017 bull market.
However, he argues that this level has little in common with the 2017 bull run’s momentum peak and aligns more closely with the beginning of the 2018 bear market. During that point in the cycle, Bitcoin suffered a staggering 49% drop within a single month, from wick high to wick low.
Severino implies that any current similarities to the 2017 bull market are misleading from a bullish technical standpoint, as the implication is that the leading cryptocurrency is at risk of entering a similar corrective or bearish phase now.
 Bitcoin Price Can Break Either Way
Recent price action has seen Bitcoin struggling to receive strong inflows and buying momentum. On-chain data shows that many short-term holders have halted their buying activity due to the extended consolidation, which does not bode well for bullish prospects. Furthermore, the realized price model says the ongoing correction may still have weeks to run.
Nonetheless, Bitcoin has managed to hold and reject a break below $80,000 amid the recent turmoil that shook the markets. The announcement of US President Donald Trump’s proposed tariffs rattled markets, causing volatility not only in crypto but across major US equity markets.
As the Dow Jones, S&P 500, and NASDAQ pulled back in response, Bitcoin also slipped toward the $81,000 level. However, unlike its equity counterparts, it has since rebounded and reclaimed ground above $83,000, which can be interpreted as early signs of decoupling from traditional financial indices.
This is actually wild to see— for the first time, Bitcoin is decoupling right before our eyes
pic.twitter.com/b4G3HWqWBo
— Cory Bates (@corybates1895) April 4, 2025
At the time of writing, Bitcoin is trading at $83,693.
Featured image from Pexels, chart from TradingView


