Menu

Categories:

Hot right now:

Follow on:

Coinsurges provides coverage of fintech, blockchain, and Bitcoin, delivering the most recent news and analyses on the future of money. Stay up-to-date with live prices, charts, and trading options for the top exchanges. Keep track of the day's top cryptocurrency gainers and losers, as well as which coins have experienced gains and losses in the past 24 hours.
Trust Coinsurges as your go-to source for all news and updates in the industry.

Ethereum Inverse Head And Shoulders – The Pattern That Could Spark A Reversal

Share This Post

Beneath Ethereum’s recent price stagnation lies a potentially explosive setup taking shape. The emergence of a near-perfect inverse head and shoulders pattern suggests that ETH may be preparing to shake off its sluggishness. This stealthy accumulation pattern, now approaching its make-or-break moment, has historically preceded some of Ethereum’s most dramatic rallies.

Ethereum’s current chart structure reflects this classic pattern, where the price has formed a “left shoulder,” followed by a deeper “head” and a “right shoulder,” with the neckline acting as a critical resistance level.

Understanding Ethereum’s Inverse H&S Formation

A surge for Ethereum is becoming increasingly compelling, driven by the formation of an inverse head and shoulders (H&S) pattern. This reversal pattern suggests that Ethereum could be on the verge of a significant upward move after a period of consolidation. If the pattern completes successfully, the inverse H&S formation typically indicates an imminent bullish trend.

One key factor to watch is the neckline of the inverse H&S, which serves as a critical resistance level represented by a yellow line on the chart. For Ethereum to confirm this bullish reversal, it needs to break above the neckline. A successful breakout above this level would signal growing buying pressure, potentially triggering a surge toward higher price levels.

Ethereum

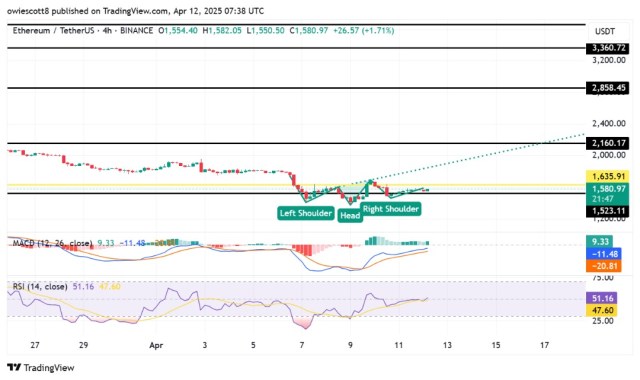
Moreover, supporting indicators like the Relative Strength Index (RSI) and Moving Average Convergence Divergence (MACD) show improving momentum, further strengthening the case for a rally. The RSI, in particular, remains in a neutral zone, giving room for more upward movement without hitting overbought territory. 

With these technical signals in place, ETH might be preparing for a major surge, especially if it can hold above critical support levels and push through the neckline of the inverse head and shoulders pattern.

Ether’s Bullish Reversal: Key Levels To Watch

Beyond the neckline, Ethereum faces additional resistance at several strategic levels. The first notable level is around $2,160. A break above this zone may push Ethereum to challenge the next resistance at $2,858, where selling pressure has historically been more intense. 

If the price can push through these levels, ETH would be primed for a potential run toward $3,360, a critical area marked by previous price highs. Each of these resistance levels represents psychological barriers for traders. 

As ETH approaches these zones, it will be essential to observe the volume and momentum accompanying the price action. A breakout above these resistance points, confirmed by increasing volume and positive technical indicators, hints at a prolonged rally, pushing Ethereum to even higher price targets.

Ethereum

Read Entire Article
spot_img
- Advertisement -spot_img

Related Posts

Could XRP Price lag be due to new PayFi Token Remittix, as it Soars to $15M Raised in ICO?

This content is provided by a sponsor PRESS RELEASE While the Bitcoin price has already climbed back to above $100k, the XRP price has remained stuck in the $2 zone As XRP stalls, Remittix(RTX), an

Bitcoin Barely Budges Despite Softer US CPI Data – What’s Next For BTC?

Bitcoin (BTC) remained largely stable after the release of the US Consumer Price Index (CPI) for April 2025, which came in below expectations The data suggests inflation is continuing to cool, a

5 Utility Blockchain Tokens Revolutionizing Telecom in 2025

The post 5 Utility Blockchain Tokens Revolutionizing Telecom in 2025 appeared first on Coinpedia Fintech News The telecommunications industry has developed past simple connectivity At this time, it

Saylor’s Strategy: How Investment Firm Jeffries Seized A New Crypto Opportunity

Do you know how Saylor became the ‘Bitcoin Messiah’ and Strategy a $116B giant in six years, averaging a $20B annual growth Here’s how it happened – Michael Saylor reached out to

Bullish Exchange and Gibraltar to Develop Regulatory Framework for Crypto Derivative Clearing

Cryptocurrency exchange Bullish has announced a partnership with the Gibraltar Government and the Gibraltar Financial Services Commission (GFSC) to develop the world’s first regulatory

XRP Whale Accumulation Surges as Institutions Double Down on Ripple Ledger

The post XRP Whale Accumulation Surges as Institutions Double Down on Ripple Ledger appeared first on Coinpedia Fintech News A bold claim by crypto influencer Pumpius is shaking up the XRP community