After weeks of downward price action, Bitcoin (BTC) is finally showing signs of a bullish reversal. The leading cryptocurrency’s weekly Relative Strength Index (RSI) has recently broken its trendline, fueling optimism for a potential major breakout.
Bitcoin Weekly RSI Turns Bullish
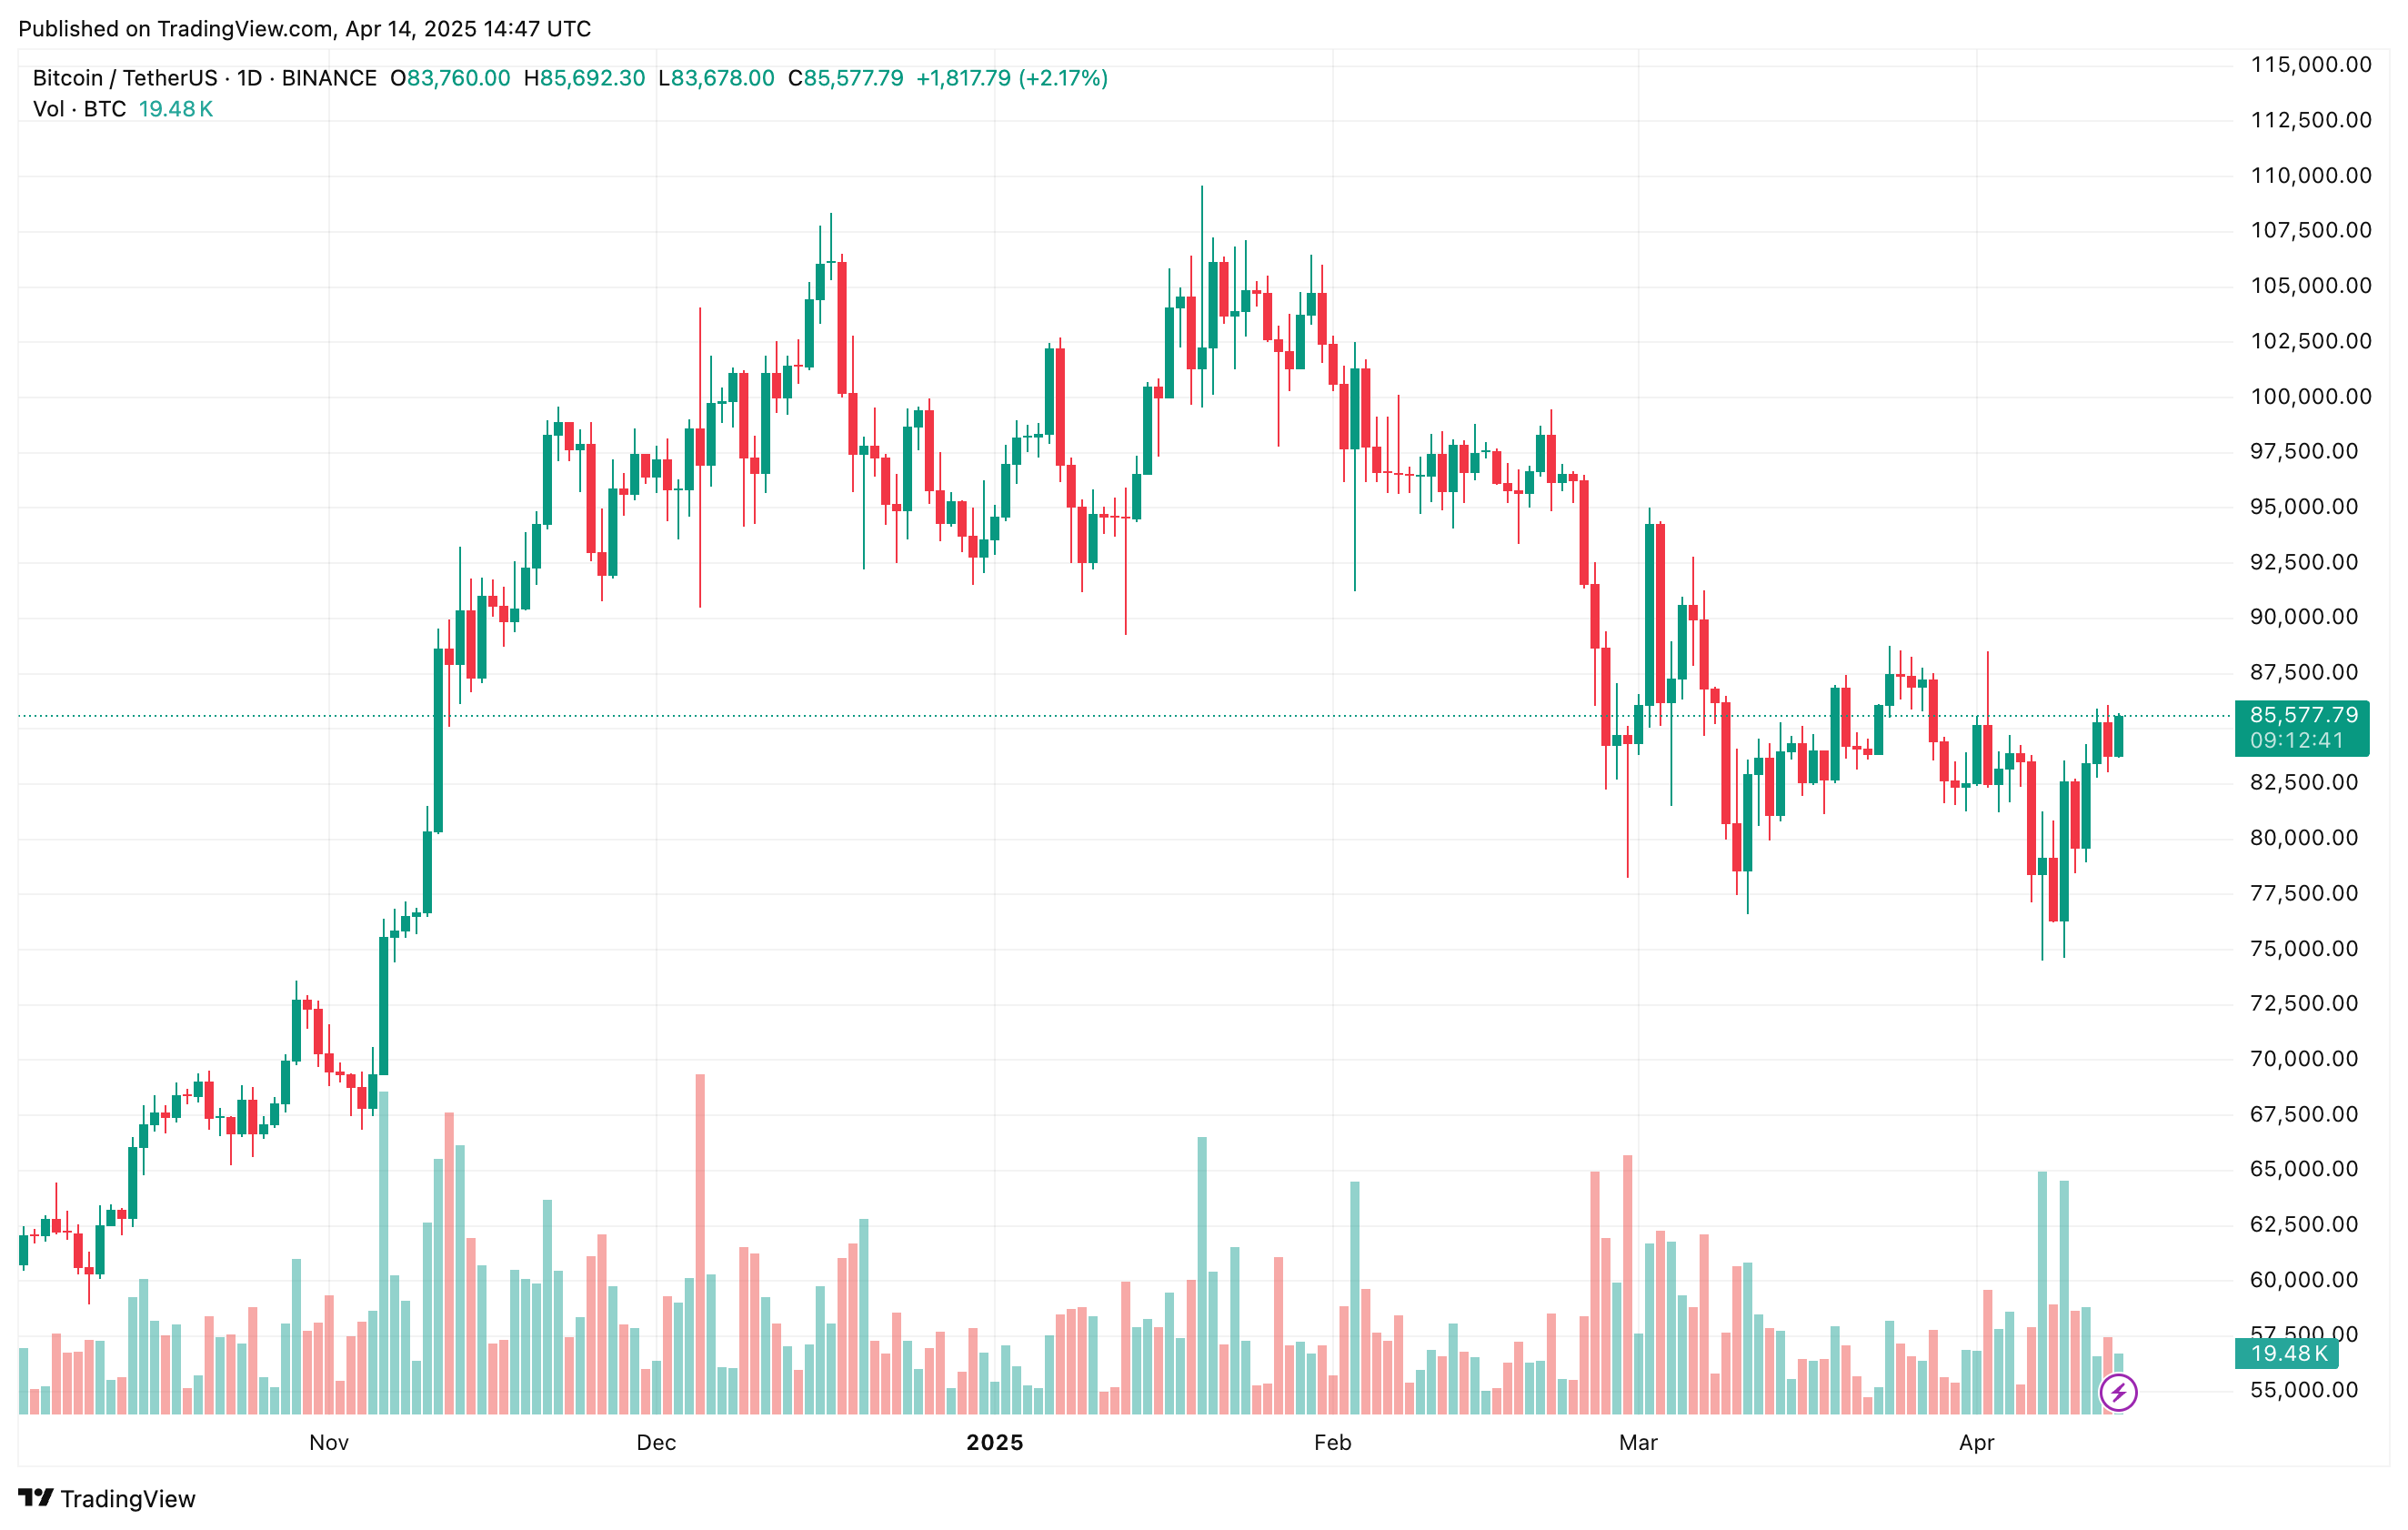
Bitcoin has struggled under the weight of escalating global tariff wars, with the flagship digital asset losing more than 10% over the past three months. However, it appears to have found some stability in the low $80,000 range after dipping as low as $74,508 on April 6.
In an X post published earlier today, crypto analyst Titan of Crypto suggested that BTC may be on the cusp of a “major breakout.” The analyst highlighted BTC’s weekly RSI breaking above its long-standing trendline – a technical development that often precedes significant momentum shifts in price action.
For the uninitiated, BTC’s weekly RSI is a momentum indicator that measures the speed and change of the digital asset’s price movements over a one-week timeframe. It helps identify whether BTC is overbought – typically above 70 – or oversold – typically below 30 – signaling potential trend reversals or continuations.
In the chart shared by Titan of Crypto, BTC’s weekly RSI can be seen breaking a downtrend for the third time since September 2024. Interestingly, the previous two breakouts in weekly RSI were followed by major rallies that pushed Bitcoin’s price significantly higher in the weeks that followed.
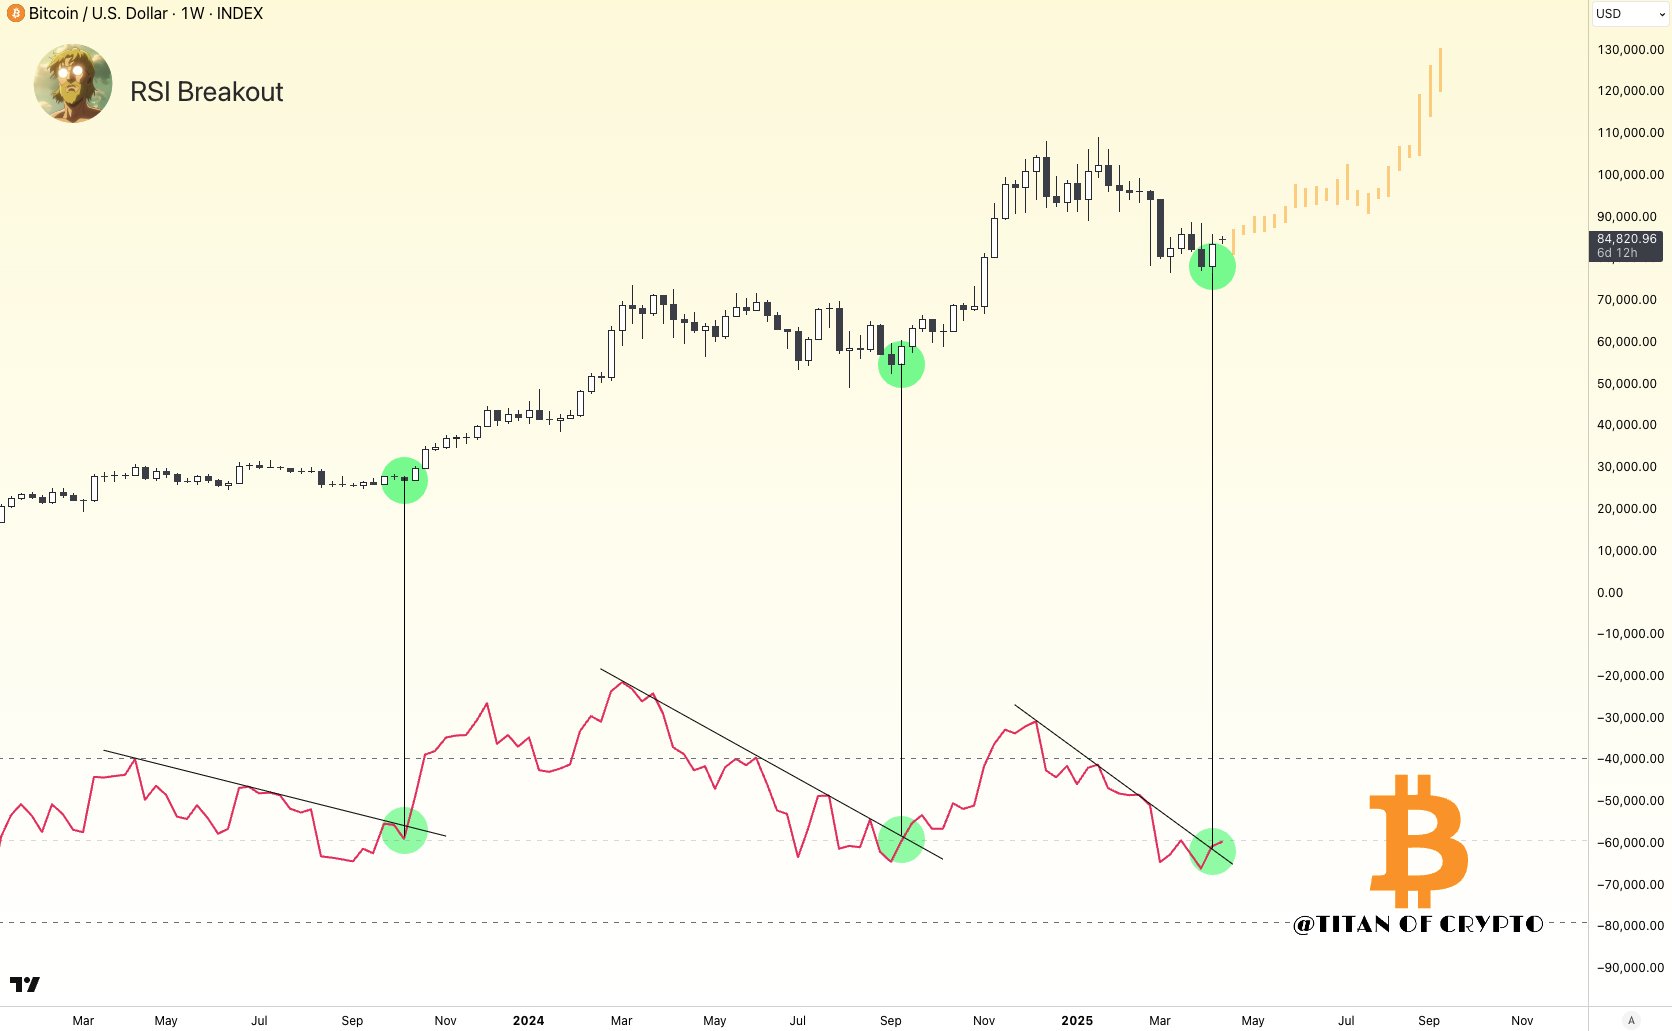
Using a price fractal pattern – highlighted in yellow – Titan of Crypto suggested that if BTC mirrors previous price behavior following RSI breakouts, it could climb to as high as $130,000. Such a move would mark a new all-time high (ATH) for the asset and signal renewed market enthusiasm.
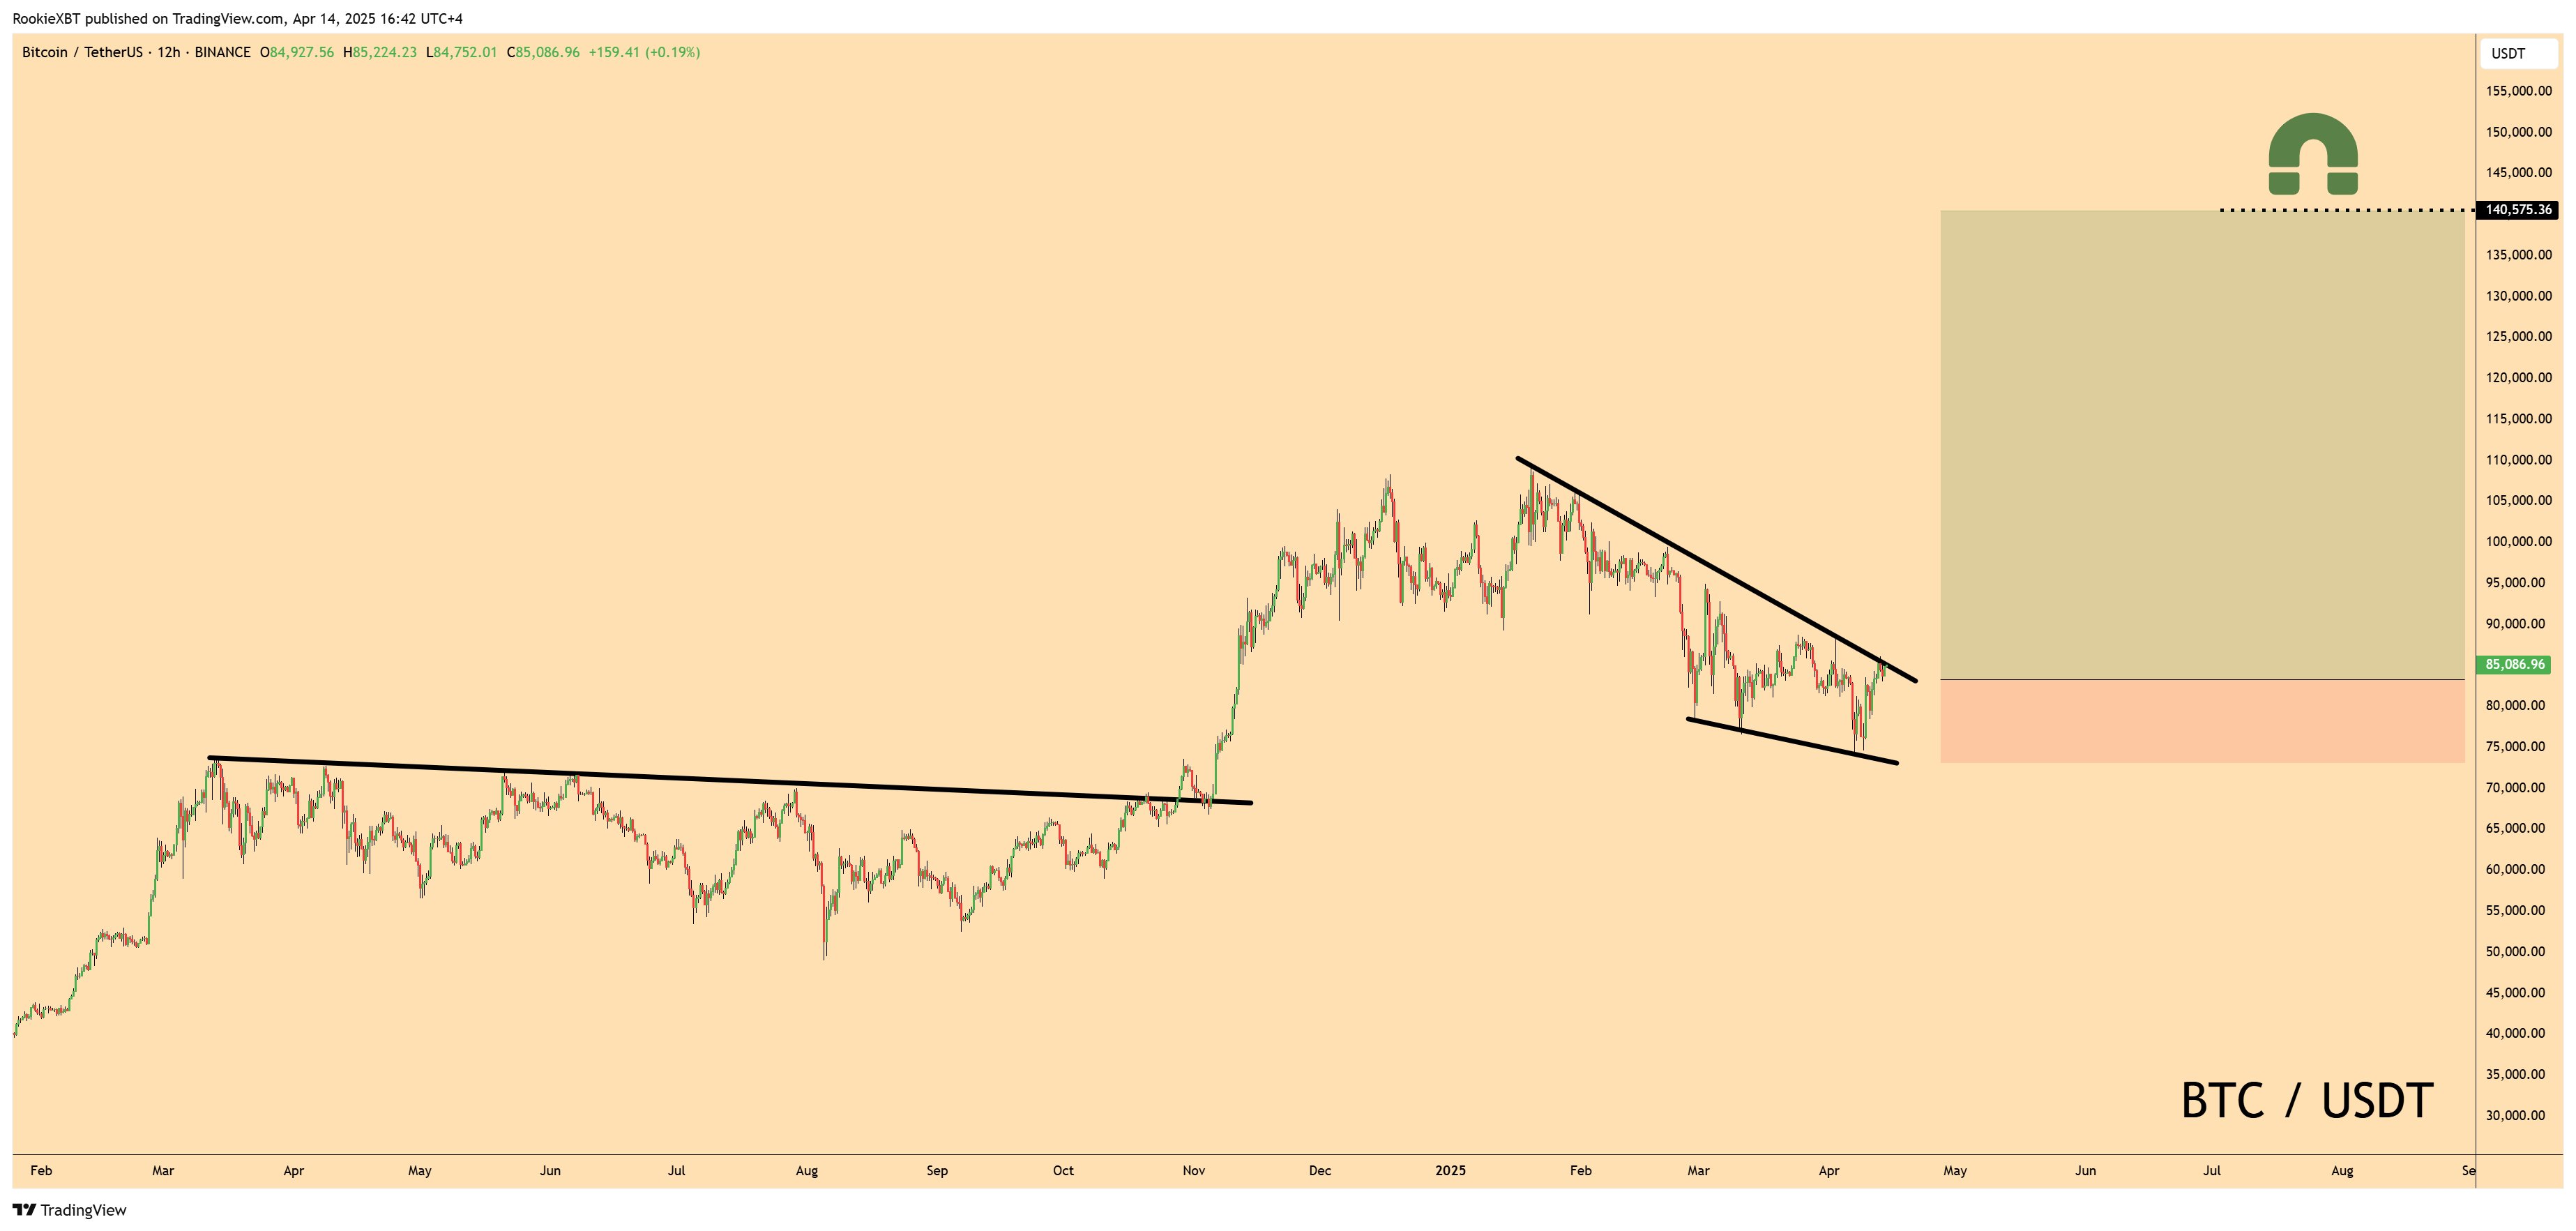
Similarly, fellow crypto analyst RookieXBT pointed out that BTC is currently trading inside a falling wedge pattern on the 12-hour chart. Falling wedge formations typically resolve to the upside, and RookieXBT suggests that a breakout could drive BTC’s price to around $140,575.
BTC Could Be Showing A False Bullish Momentum
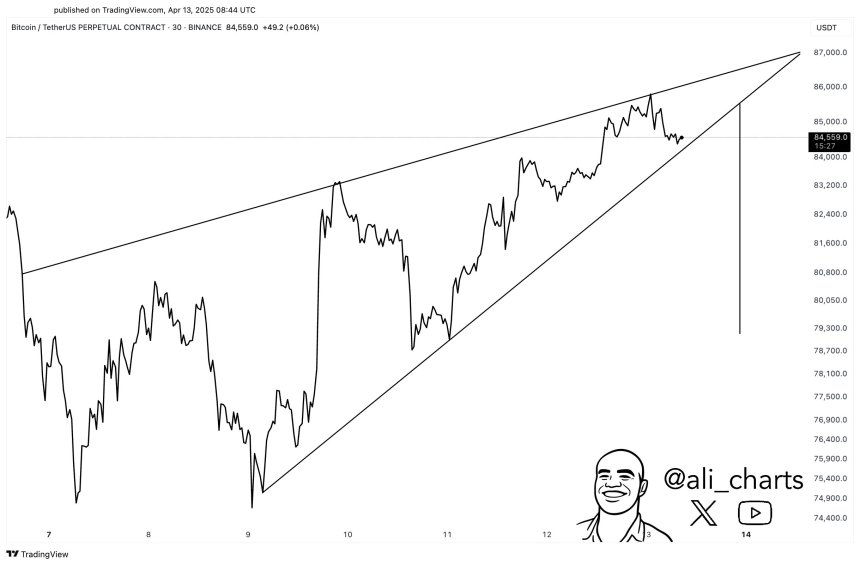
However, not all analysts share the same bullish outlook. Seasoned crypto analyst Ali Martinez offered a contrasting view, warning that BTC may be forming a rising wedge pattern – a bearish technical signal that could lead to downside pressure. If this pattern plays out, Martinez believes BTC could fall back to the critical support level at $79,000.
In addition to chart patterns, macroeconomic tensions continue to loom large. The ongoing tariff disputes are putting pressure on risk assets, including BTC.
Adding to the concerns, Bitcoin recently formed a “death cross” – a bearish technical signal where the 50-day moving average crosses below the 200-day moving average – which may result in further losses. At press time, BTC trades at $85,577, up 1.9% in the past 24 hours.