Ethereum Price Prediction – January 8
The Ethereum price prediction reveals that ETH is currently trading above $3200 after a significant dip towards $3000.
ETH/USD Market
Key Levels:
Resistance levels: $3500, $3600, $3700
Support levels: $2900, $2700, $2800
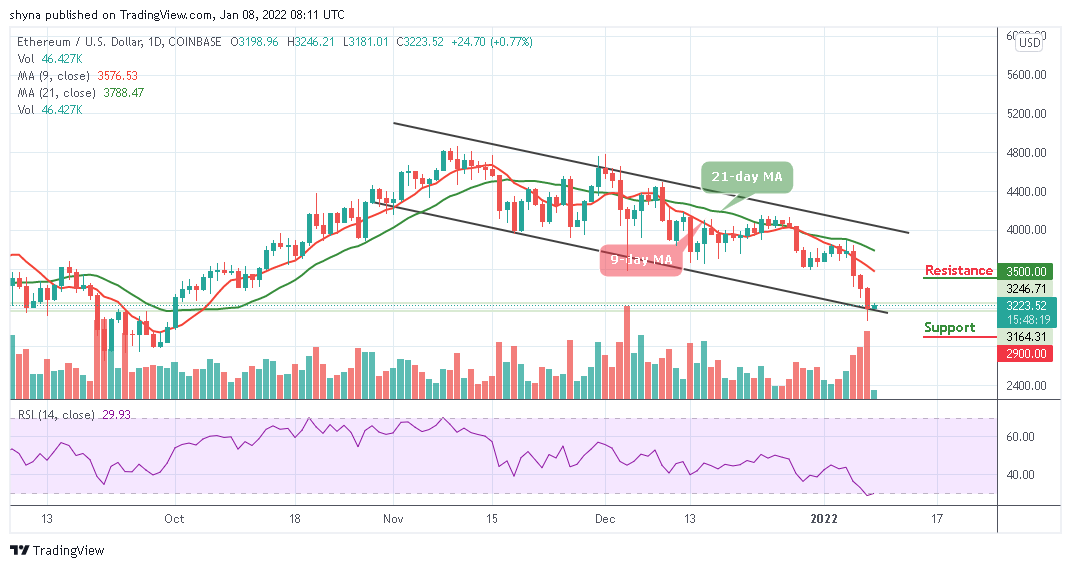
At the time of writing, ETH/USD is trading at $3223 where a bearish momentum is building but the technical indicator Relative Strength Index (14) shows that the bearish movement may be coming close as the signal line is likely to leave the oversold region. However, the 9-day and 21-day moving averages indicates that bears are still having the ability to control the market as the 9-day MA is remains below the 21-day MA.
Ethereum Price Prediction: What to Expect from Ethereum
As the Ethereum price is hovering below the moving averages and trades around the lower boundary of the channel, the coin is likely to embark on a movement towards the upside. Therefore, a sustainable move from this barrier may improve the bullish movement and allow for an extended recovery towards the resistance level of $3300. However, if the coin stays above this level, it could negate the bearish scenario and bring the nearest resistance of $3500, $3600, and $3700 levels into play.
Nevertheless, the RSI (14) on the daily chart may move out of the negative side but a failure to remain at the oversold region could worsen the technical picture and lay the ground for the further sell-off towards below the lower boundary of the channel. Any further bearish movement could be locate the supports at $2900, $2800, and $2700 respectively.
Against Bitcoin, the market price remains below the 9-day and 21-day moving averages as the bears are dominating the market. Now, ETH/BTC is trading at 7667 SAT and the bulls couldn’t push the price to cross above the moving averages. Looking at the chart, if the market continues to drop, the next key support may likely be at 7200 SAT and below.
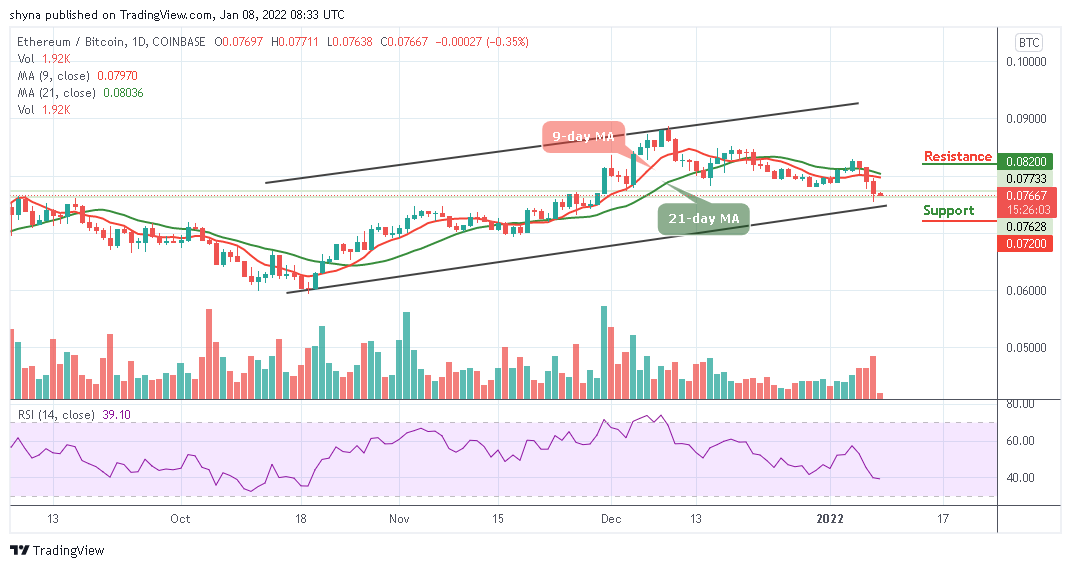
However, on the upside, if coin crosses above the moving averages, the resistance level of 8200 SAT and above may be visited. Meanwhile, the technical indicator Relative Strength Index (14) is moving around 40-level, suggesting that the market may continue to go down.
Looking to buy or trade Ethereum (ETH) now? Invest at eToro!
68% of retail investor accounts lose money when trading CFDs with this provider


