Bitcoin Price Prediction – January 25
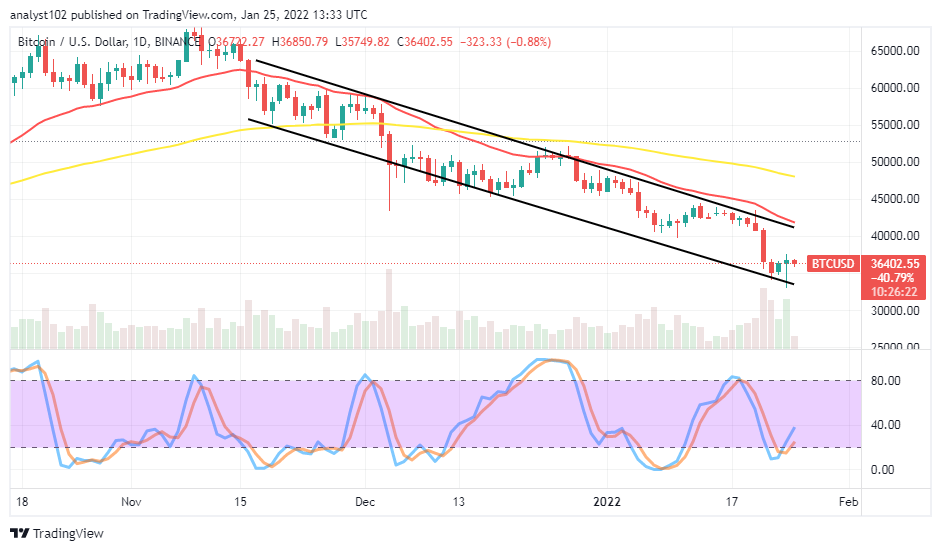
The bearish trading situation of the BTC/USD trade activities shows the crypto-economic market declines, holding below $37,500. The crypto’s price currently trades between the high and low of $36,850 and $35,749 at a minute negative percentage rate of about 0.88.
BTC/USD Market
Key Levels:
Resistance levels: $40,000, $42,500, $45,000
Support levels: $32,500, $30,500, $27,500
BTC/USD – Daily Chart
The BTC/USD daily chart showcases the crypto-economic market declines, holding below $37,500. Yesterday’s bearish candlestick emerged, pushing through psychological support levels before regaining the grand for a rallying motion. The 50-day SMA indicator is above the 14-day SMA indicator. The Stochastic Oscillators have crossed their lines northbound faintly to touch the range of 40. A tinier bearish-promising candlestick is in the making to suggest the possibility of seeing more downs in the near time.
Will the BTC/USD trade relaxes southward pushes as the crypto market declines, holding below $37,500?
Expectantly, the BTC/USD trade may only relax its southward pushing efforts closely around $37,500 as the crypto-economic declines, holding below it. It’s somewhat that the market has encountered resistance around the value line to put back the trading activities into a downward trend continuation after a while. A sudden spike above that value line in question may in no time witnesses a reversal to make terrible conditions for buying entering order at that trading capability.
On the downside of the technical analysis, the BTC/USD market short-position takers needed to be wary of a sudden fearful breakout against the resistance levels involving the $37,500 and $40,000. If that situation comes to play out, opened selling positions may expose to a long-whipsawed trading condition in the long run, except price timely returns into a correctional-moving manner to invalidate that assumption in the end.
BTC/USD 4-hour Chart
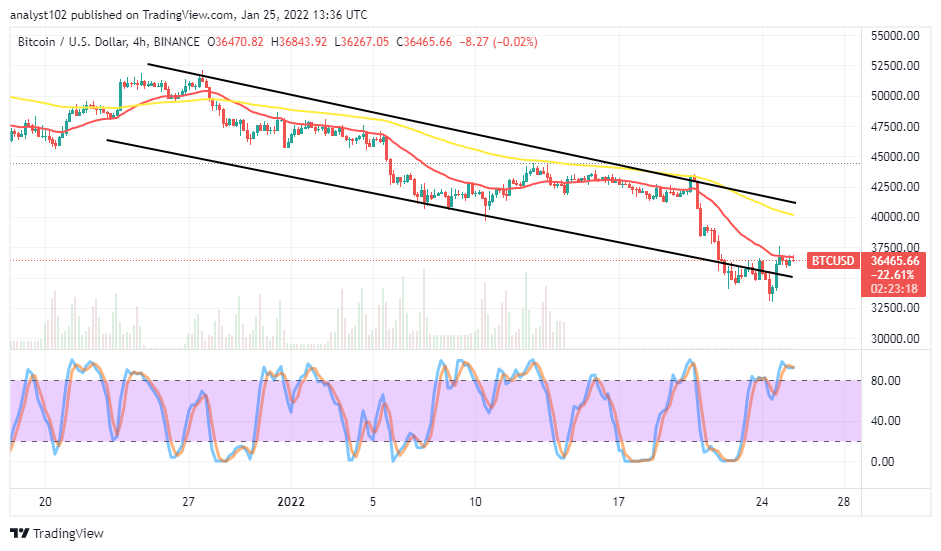
The BTC/USD 4-hour chart shows the crypto-economic market declines, holding below $37,500 as the trend line of the smaller SMA touched. A few hours ago, the price tested the value line from beneath. The 50-day SMA indicator is above the 14-day SMA indicator as the bearish channel trend lines drew downward, ultimately trying to embody the downward trending lines of the SMAs. The Stochastic Oscillators are in the overbought region, clogging within it. It appears all is getting set that a depression resumes soon around the point mentioned earlier.
Looking to buy or trade Bitcoin (BTC) now? Invest at eToro!
68% of retail investor accounts lose money when trading CFDs with this provider.
Read more:


