After touching the resistance level of $43,000, the Bitcoin price prediction retreats and prepares for another downward movement.
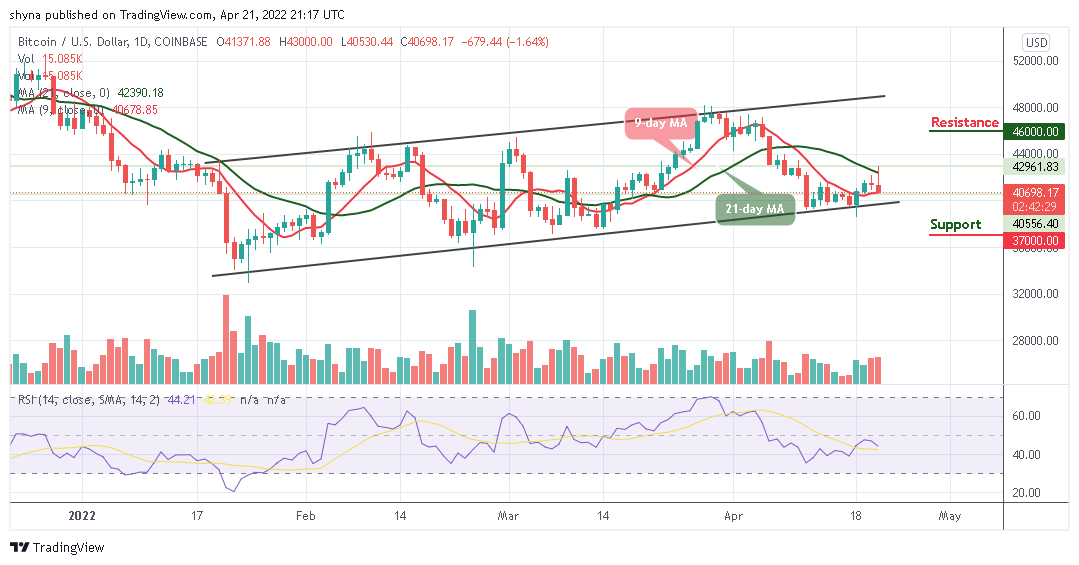
BTC/USD Long-term Trend: Ranging (Daily Chart)
Key levels:
Resistance Levels: $46,000, $48,000, $50,000
Support Levels: $37,000, $35,000, $33,000
Looking to buy or trade Bitcoin (BTC) now? Invest at eToro!
68% of retail investor accounts lose money when trading CFDs with this provider
BTC/USD is preparing for a new downtrend as the price retreats and touches the daily low of $40,530. The resistance level at $43,000 has been a tough resistance line that the coin has not been able to cross. Meanwhile, traders are not surprised by the selling pressure as bears are trying to drag the price below the 9-day and 21-day moving averages. However, until bulls break more upsides, the king coin may likely face a little sideways movement for a while.
Bitcoin Price Prediction: What to Expect from Bitcoin (BTC)
According to the daily chart, the Bitcoin price is moving down with a loss of 1.64% at its current price of $40,698. However, the coming few days may likely shine a light on Bitcoin’s outlook, as it is currently trading at a pivotal point. Therefore, any decline or rise from the current level could determine the trend of the price movement.
Presently, BTC/USD is currently sliding below the moving averages, with bears moving to erase the gains that came about at the early hour of today’s trading. However, if the coin remains above the moving averages, it may push the price to the resistance level of $46,000, $48,000, and $50,000 while the supports are located below the moving at $37,000, $36,000, and $34,000 as the technical indicator remains below the 50-level.
BTC/USD Medium-Term Trend: Ranging (4H Chart)
According to the 4-hour chart, the resistance at $43,000 has been too heavy for the bulls to overcome as the price is now struggling in a consolidation mode, which has made the cryptocurrency remain indecisive over the past few hours now. The next key resistance level remains at $42,500 and above.
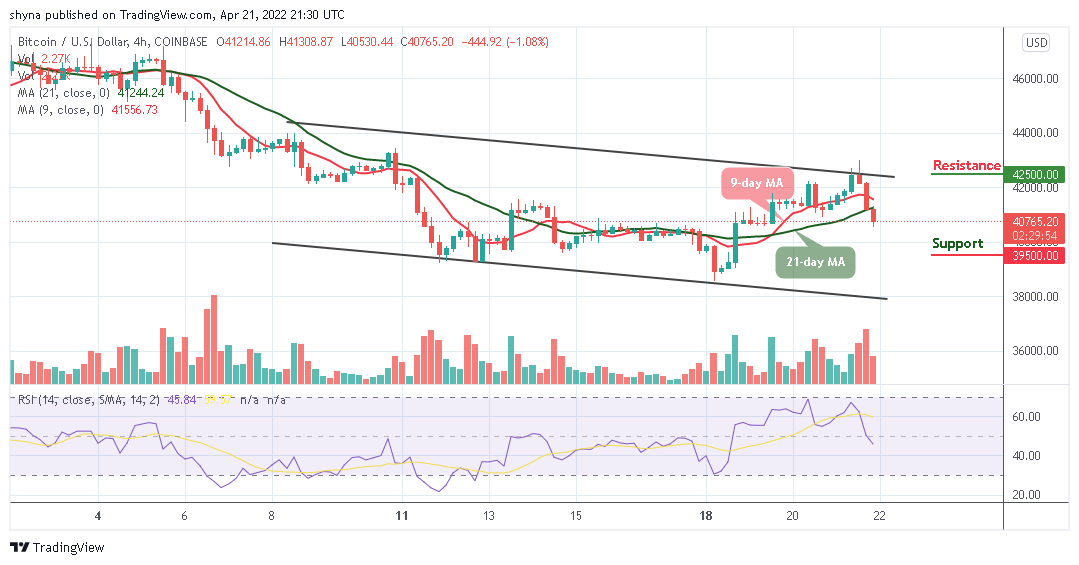
However, the coin is still roaming around $40,765 as bears are pushing the price below the 9-day and 21-day moving averages. Meanwhile, the $39,500 and below may come into play as the technical indicator moves below 50-level.
Looking to buy or trade Bitcoin (BTC) now? Invest at eToro!
68% of retail investor accounts lose money when trading CFDs with this provider
Read more:


