The Bitcoin price prediction is hovering below the moving averages as of late, with the daily low being located around the $39,428 level.
BTC/USD Long-term Trend: Ranging (Daily Chart)
Key levels:
Resistance Levels: $44,000, $46,000, $48,000
Support Levels: $36,000, $34,000, $32,000
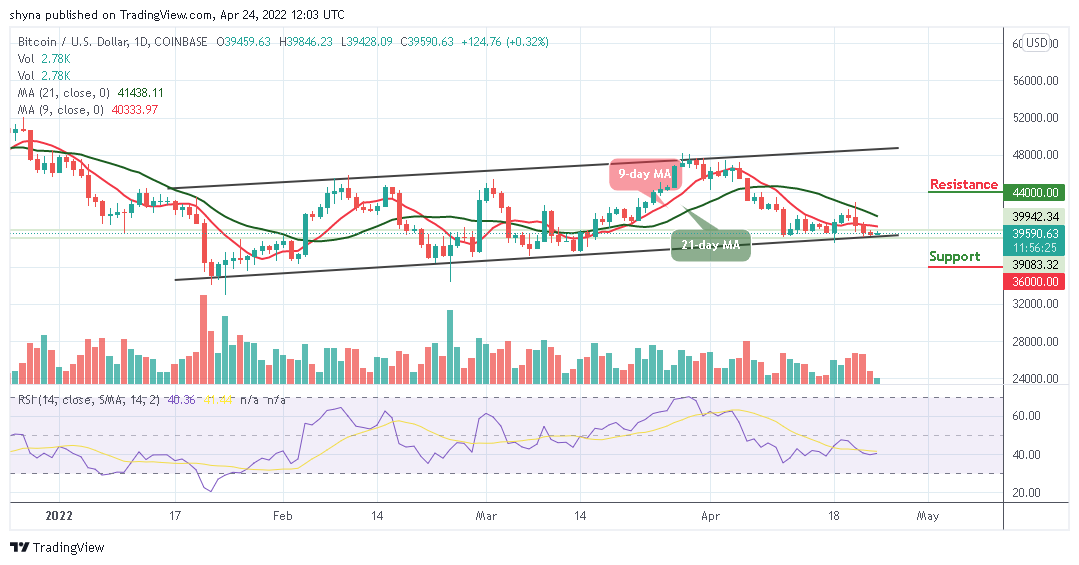
BTC/USD is trading below the 9-day and 21-day moving averages as the king coin is likely to resume a downtrend if the market price crosses below the lower boundary of the channel. However, until the bulls break above the moving averages and head towards the upper boundary of the channel, the king coin is likely to face a prolonged sideways move.
Bitcoin Price Prediction: Bitcoin (BTC) May Fall to Rising Again
At the time of writing, the Bitcoin price is trading up with a slight gain of 0.32% at its current price of $39,590. However, the current market movement could mark a slight decline if the king coin crosses below the channel to bring the price to the negative side, as it could touch the support level of $38,000.
Nevertheless, the Bitcoin (BTC) remains below the moving averages, with bulls pushing the price towards the north but any further bullish movement above the 9-day moving average may take the price to the resistance levels of $44,000, $46,000, and $48,000 while the support levels could be located at $36,000, $34,000, and $32,000 as the technical indicator Relative Strength Index moves around 40-level.
BTC/USD Medium-Term Trend: Ranging (4H Chart)
The 4-hour chart reveals that the Bitcoin price is now struggling in a consolidation mode, and it has made the cryptocurrency delay its crossing above the 9-day and 21-day moving averages. Meanwhile, as the coin trades around the 9-day moving average, moving towards the lower boundary of the channel could hit the support at $38,000 and below.
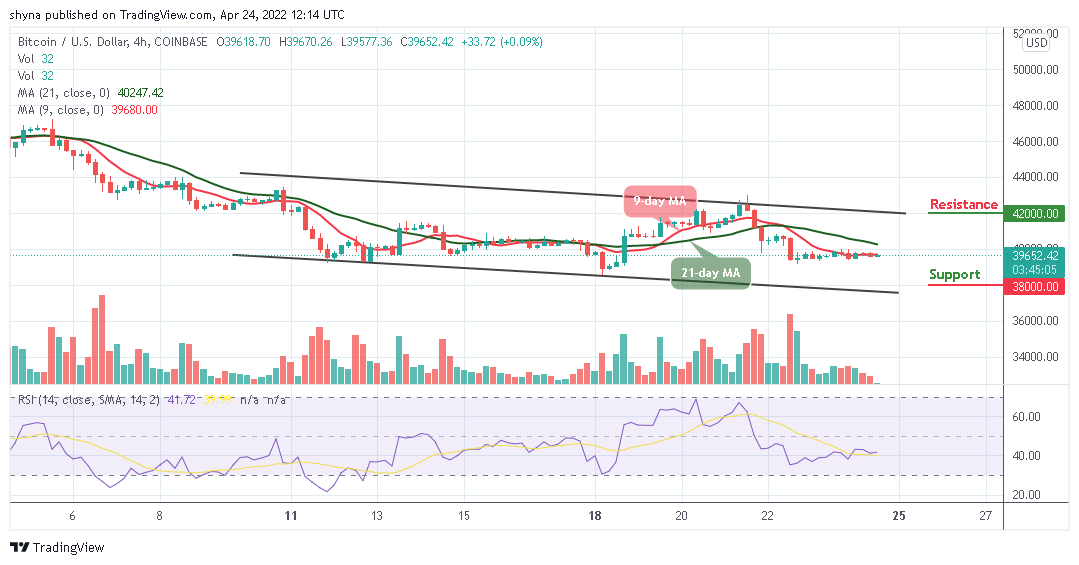
However, the Bitcoin price is hovering at $39,652 as the bulls attempt to push the price towards the 21-day moving average. More so, the resistance level of $42,000 and above may come into play if the technical indicator Relative Strength Index (14) crosses above 50-level.
Looking to buy or trade Bitcoin (BTC) now? Invest at eToro!
68% of retail investor accounts lose money when trading CFDs with this provider
Read more:


