The Solana price prediction shows that SOL is facing the upside as the coin moves to break above the 9-day moving average to reach $100.
SOL/USD Market
Key Levels:
Resistance levels: $120, $125, $130
Support levels: $75, $70, $65
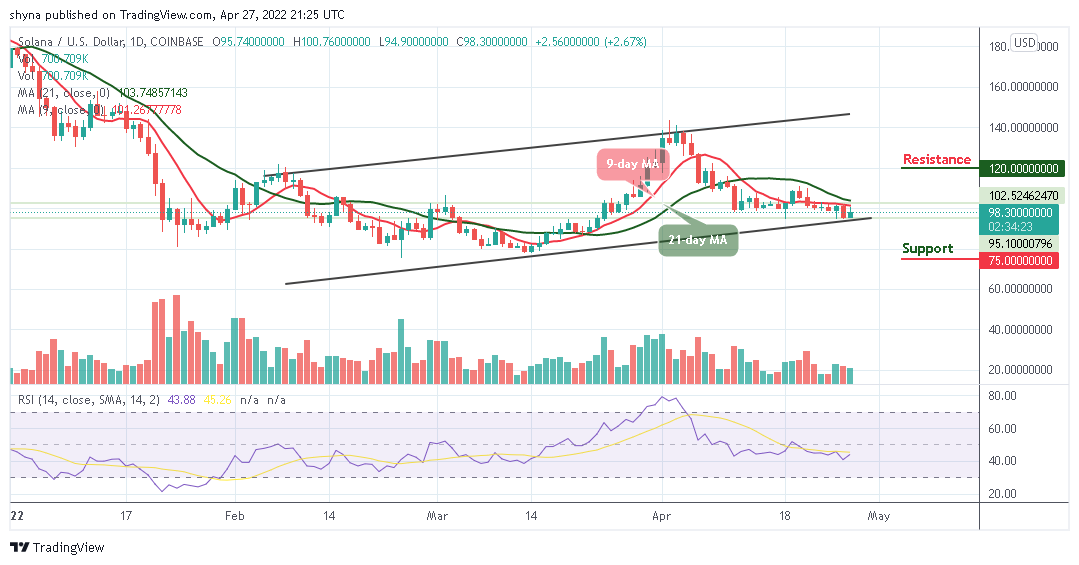
SOL/USD is moving to cross above the 9-day moving average to begin the bullish movement within the channel. According to the daily chart, the Solana price is likely to shoot to the upside as the technical indicator Relative Strength Index (14) moves to cross above 50-level. Therefore, the market is projecting a volatile movement where Solana may continue to follow the bullish movement.
Solana Price Prediction: SOL Price Aims at the Upside
As the daily chart reveals, the Solana price touches the daily high at $100 today so that the coin can begin to create additional high levels above the 9-day and 21-day moving averages. On the other hand, any bearish movement below the lower boundary of the channel may bring the price to the support levels of $75, $70, and $65.
However, considering a continuous bullish movement for this coin, SOL/USD may spike above the moving averages to hit the potential resistance levels of $120, $125, and $130 in the long-term bullish. Nevertheless, the technical indicator Relative Strength Index (14) is likely to cross above 50-level, suggesting additional bullish movements for the market.
SOL/BTC Market: Solana Price May Consolidate below the Moving Averages
When compared with Bitcoin, the Solana price is seen trading below the 9-day and 21-day moving averages where the price is expected to break to the upside. However, should the price succeed, it may begin an upward trend which could touch the potential resistance level of 2900 SAT and above.
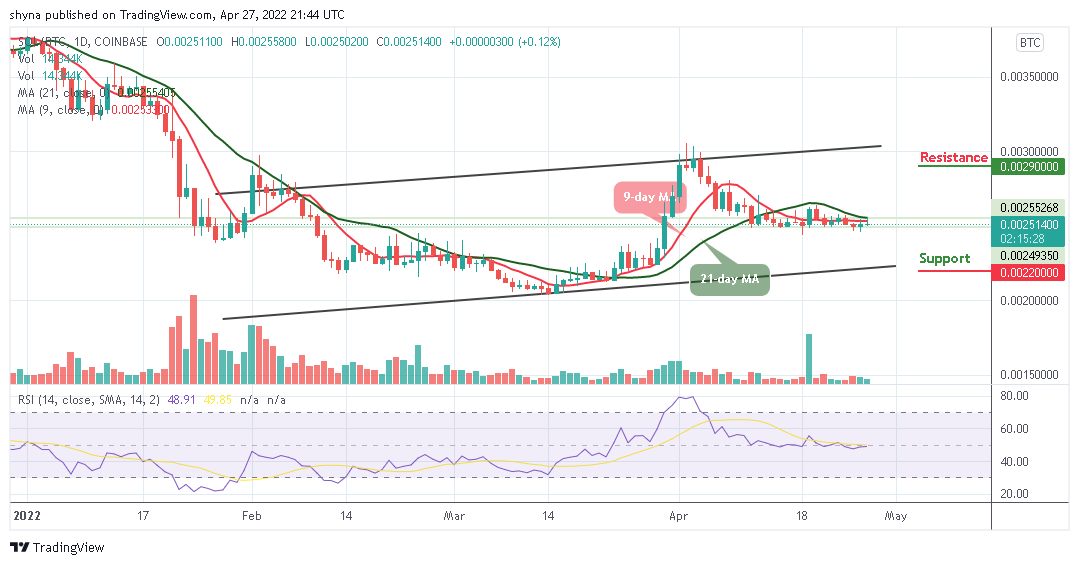
On the contrary, if the SOL price slides and faces the lower boundary of the channel, the coin is expected to locate the support at 2200 SAT and below. Moreover, the technical indicator Relative Strength Index (14) moves in the direction around the 50-level which reveals that the Solana price may continue to move sideways before heading to the upside.


