The Cardano price prediction continues to slide below the 9-day and 21-day moving averages after touching the daily high of $0.79.
ADA/USD Market
Key Levels:
Resistance levels: $1.10, $1.20, $1.30
Support levels: $0.52, $0.42, $0.32
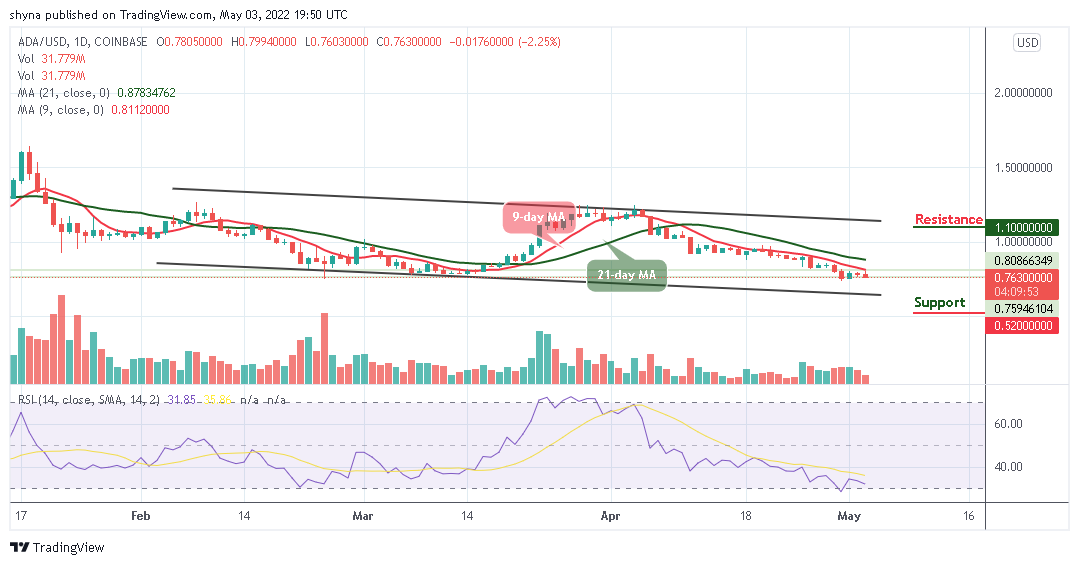
Looking at the daily chart, ADA/USD continues to hover below the 9-day and 21-day moving averages. The Cardano price may slide below the nearest support at $0.75 if the bears increase the bearish momentum. However, if the sellers continue to take charge, the coin may be losing momentum to the lower side of the channel along with a potential price surge. Meanwhile, the technical indicator Relative Strength Index (14) faces the oversold region and may continue to issue sell signals.
Cardano Price Prediction: ADA Price May Continue to Move Down
According to the daily chart, the Cardano price is moving down below the 9-day and 21-day moving averages as the coin faces the lower boundary of the channel. However, if the coin decides to stay under the control of bears, the Cardano price may likely drop more to hit the nearest supports at $0.52, $0.42, and $0.32 respectively. On the upside, for the market to create an uptrend, the bulls need to push the market price above the 9-day and 21-day moving averages before locating the potential resistance levels at $1.10, $1.20, and $1.30.
ADA/BTC Market: Cardano Price Stays at the Downside
Against Bitcoin, the Cardano price is seen sliding below the 9-day and 21-day moving averages within the channel where the price is expected to break towards the lower boundary of the channel. However, should the price move to create a new low around 2000 SAT, the market could experience more downtrends that may hit the key support level of 1700 SAT and below.
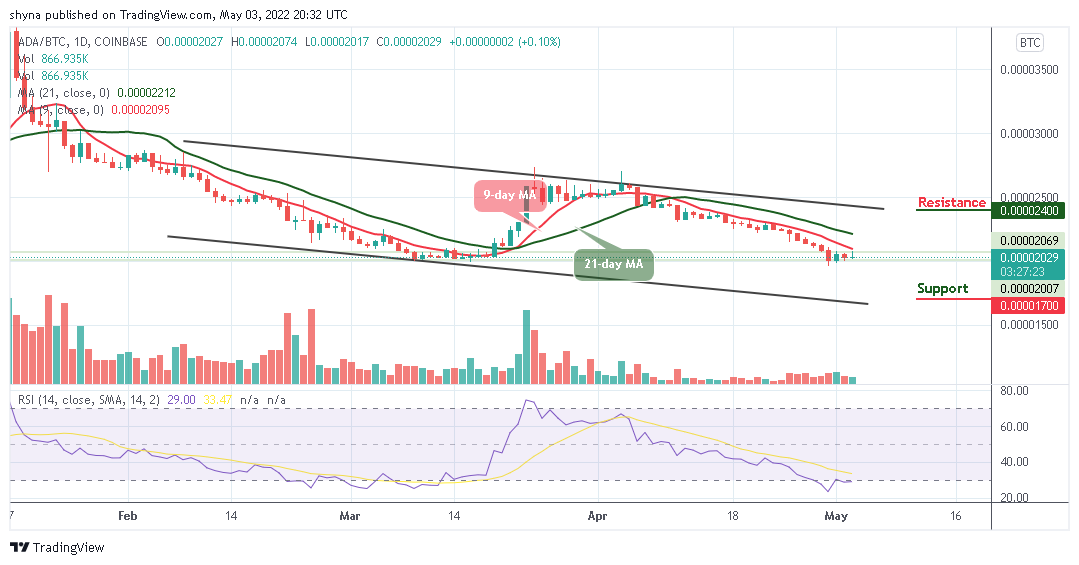
On the contrary, if the bulls could manage and push the market above the moving averages, the Cardano price may reach the resistance level of 2400 SAT and above. More so, the technical indicator Relative Strength Index (14) confirms that the market is been controlled by the sellers as the signal line remains within the oversold region.
Read more:


