The Bitcoin price prediction shows that BTC is trading at $39,723 as the coin seems to be preparing for another upward movement.
BTC/USD Long-term Trend: Ranging (Daily Chart)
Key levels:
Resistance Levels: $44,000, $46,000, $48,000
Support Levels: $33,000, $31,000, $29,000
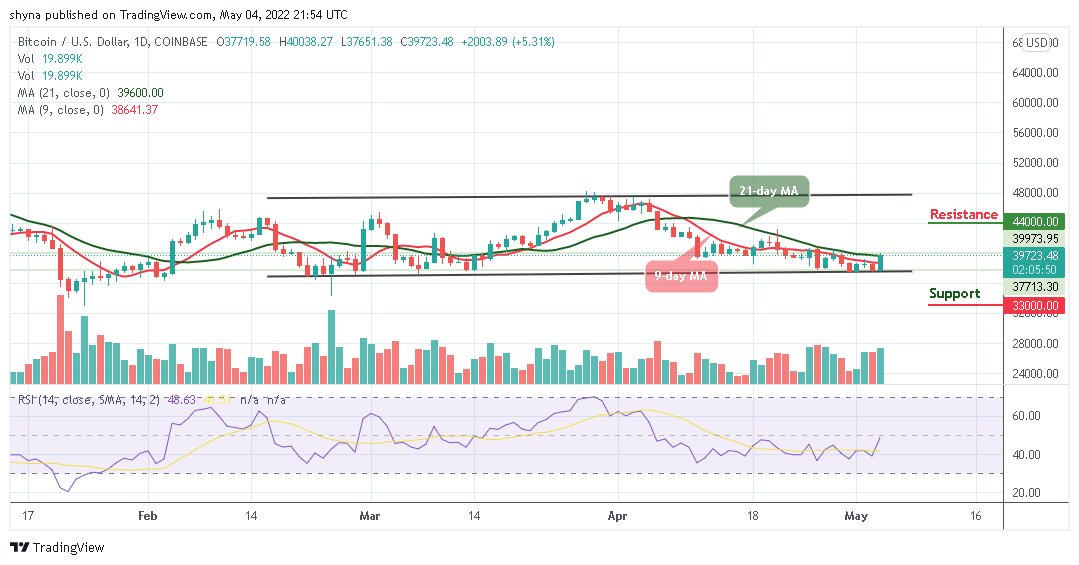
BTC/USD is trading above the 9-day and 21-day moving averages at $39,723 as the coin prepares to gain additional higher levels. At the time of writing, the first digital coin is likely to extend towards the resistance level of $40,000 if the bulls put more pressure on the market.
Bitcoin Price Prediction: BTC/USD Ready for A Cross Above $40k
At the moment, the Bitcoin price is crossing above the 9-day and 21-day moving averages, any further bullish movement above this barrier could locate the potential resistance levels at $44,000, $46,000, and $48,000. Normally, when the new uptrends are coming up, traders may use the moving averages to gauge the strength of the trend. Nevertheless, if BTC/USD soars to the upper boundary of the channel, this could be a sign of sustainability and may likely result in a bullish continuation.
Furthermore, if the Bitcoin price fails to move up; traders may see a price cut below the lower boundary of the channel, and a further low could bring the price to the support levels at $33,000, $31,000, and $29,000 respectively. But as it stands, the Bitcoin price is likely to rise as the technical indicator Relative Strength Index (14) moves to cross above 50-level.
BTC/USD Medium-Term Trend: Ranging (4H Chart)
According to the 4-hour chart, the market is following a sideways movement above the 9-day and 21-day moving averages as the bulls are coming back into the market to push the king coin above the upper boundary of the channel. If not, the support level of $38,500 and below may come into play.
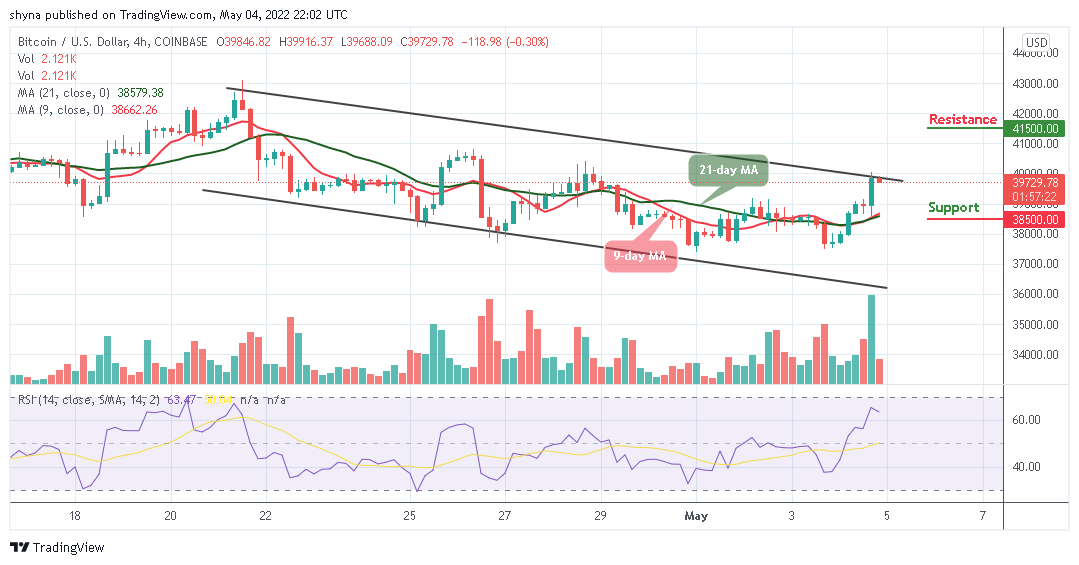
However, if the bulls push the market above the 9channel, traders may expect a retest of the $40,000 resistance level, and breaking this level may further push the price towards the resistance level of $41,500 and above as the technical indicator Relative Strength Index (14) remains above 60-level, suggesting a bearish signal.
Looking to buy or trade Bitcoin (BTC) now? Invest at eToro!
68% of retail investor accounts lose money when trading CFDs with this provider
Read more:


