Cryptocurrencies experienced on May 10 a large market crash, losing over 10% in a single day of most of the coins. This is the second time in 2022 that most cryptocurrencies have suffered a price loss of over 10%. Over the last month, BTC has accumulated a 23.57% loss while Ethereum has a 26.32%. Meanwhile, US equities suffered slightly more moderated losses: S&P 500 a -11.07% while Nasdaq 100 a -14.93%:
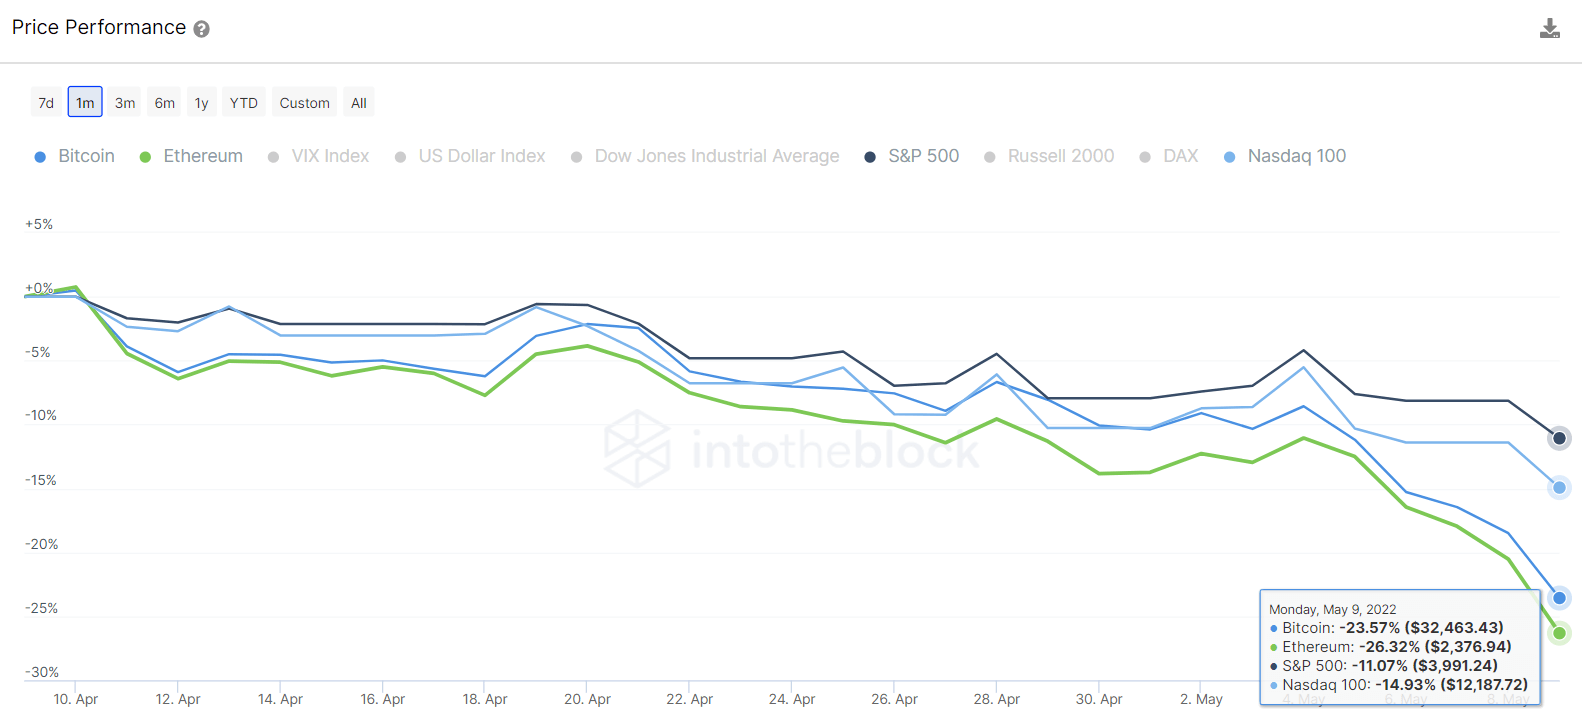
As seen in the chart above, cryptocurrencies continue experiencing worse sell-offs than capital markets. The actual macro context of rising interest rates leads to most investors becoming averse to risky assets, which cryptocurrencies are due to their nature of highly volatile price performance.
The origins of the May 10 price drop came from US equities markets turning back on their short-lived recovery of last week. As has been seen in the previous months, the 30-day correlation between the cryptocurrencies markets and US equities indexes continues to grow, and this week achieved an all-time high for both BTC and ETH, with around 0.9 points both for S&P 500 or Nasdaq 100:
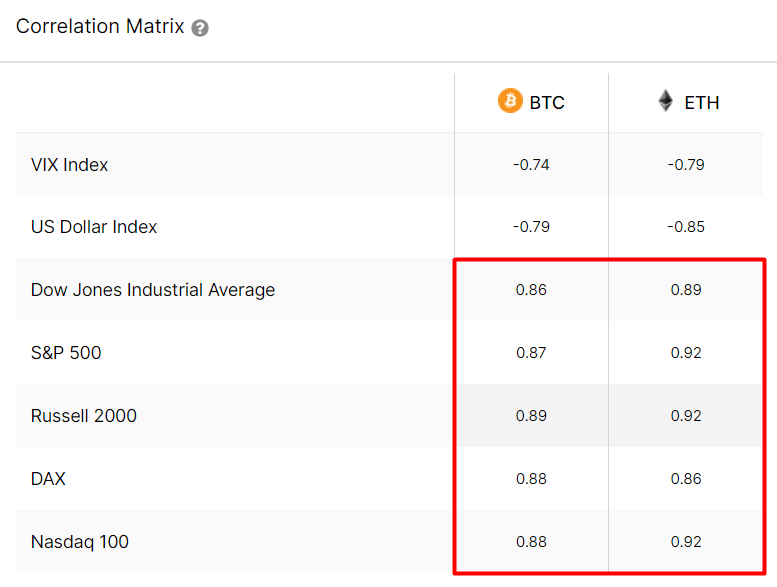
A correlation coefficient close to 1 implies a strong positive correlation between the two prices, meaning that the price of BTC or ETH and these indices have a highly statistically significant relationship, so they will tend to move in the same direction. Understanding how these relationships evolve is essential to understanding how macro markets affect the cryptocurrency market and where to look for leading indicators of crypto price movements.
It is valuable to look internally at how crypto holders are reacting to the recent price moves despite external factors. Bitcoin continues dominating the crypto market, so it is worth looking at what its on-chain data shows us.
As studied before, investors are sensitive to react when their investments turn around and stop being in a profiting position. BTC is recently reaching a critical position, where almost half (47.8%) of the addresses holding BTC would be losing money if they would sell at current prices. This is something not seen since the Covid crash of March 2020:
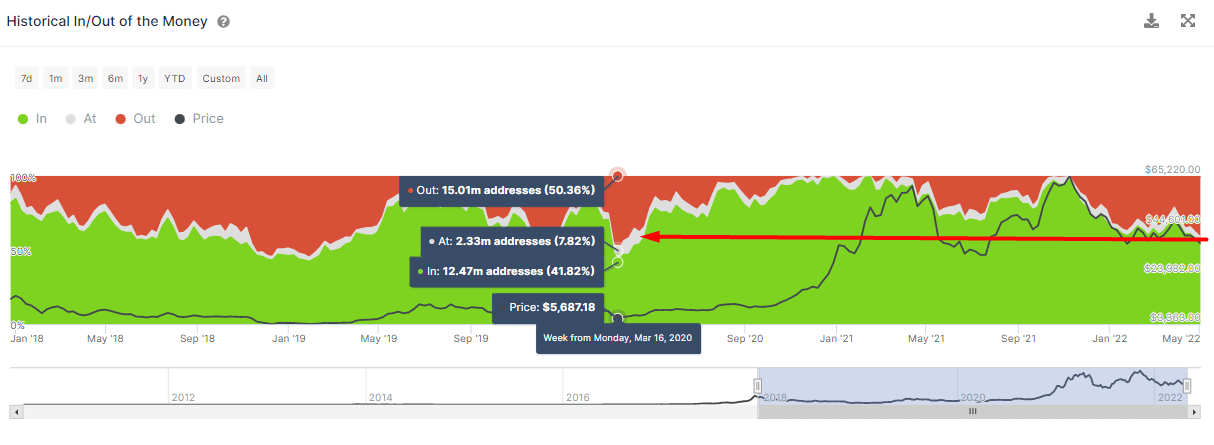
This indicator that provides the variation of holders’ profits over time also shows the percentage of addresses that would have made money or lost money if they had sold at a particular time. Addresses are classified based on if they are profiting (in the money), breaking even (at the money), or losing money (out of the money).
Addresses are a good approximation to single investors, although there is always a chance that a small minority of users are using several addresses. If we look at how long the BTC investors have been holding, we can see that the vast majority (26.74M addresses) have been holding BTC for more than a year. A metric with no signs of slowing down so far (blue line):
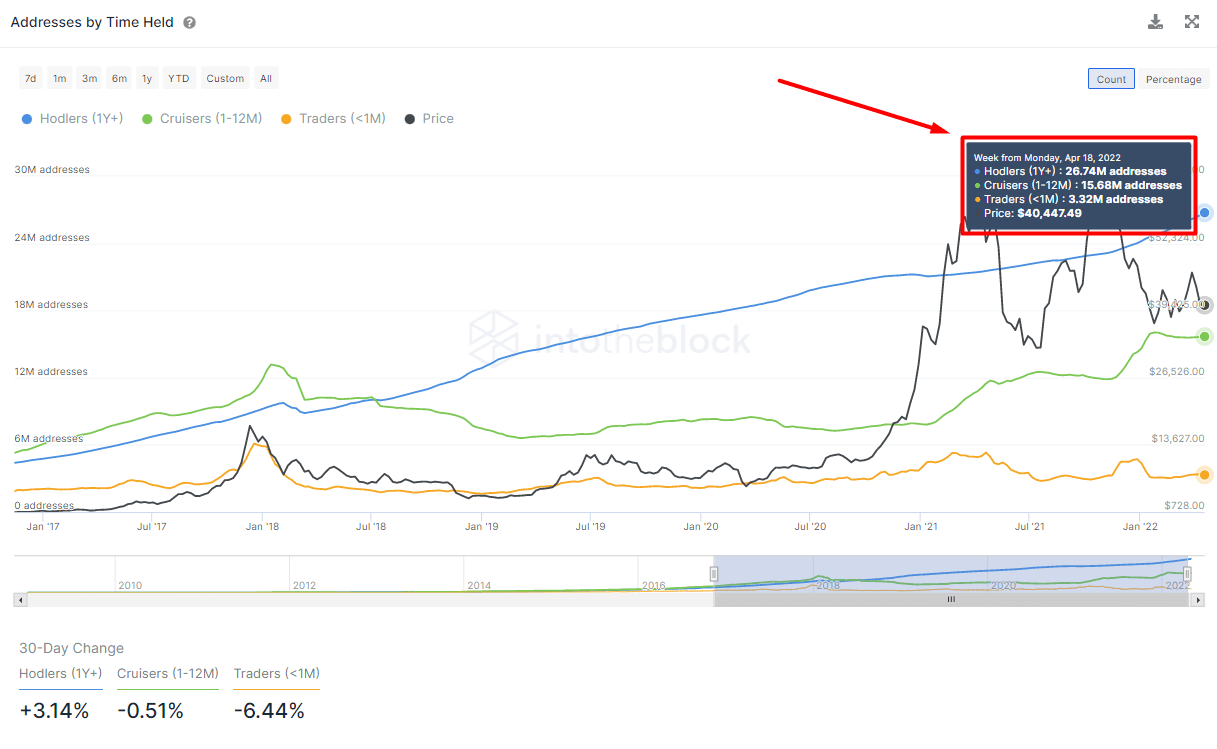
This depicts how the amount of BTC holders with a long-term perspective grows despite the recent market turmoil and crypto’s weak price performance. It is quite the opposite for short-term holders (classified as Traders, orange line in the chart): their number increases when significant price movements occur, and speculation fuels the whole ecosystem.
After the worst start of the year for US equities in 83 years, it remains open to question if the current market situation could be presenting an attractive buying opportunity for those looking to the long term. Crypto’s next price moves will undoubtedly be heavily influenced by what US equities do, although so far, at least the majority of BTC holders remain unfazed.
The post These indicators show how the equities sell-off is influencing crypto prices to fall down appeared first on CryptoSlate.


