Hedera (HBAR) Price Prediction – May 25
Over a long-term running of the HBAR/USD market operations, sellers’ reactions have had a high tell over the weakness of buyers to hold their positions firmly through subsequent resistances. The current trading outlook suggests the crypto market may decline more as it ranges around $0.10 at a 2.82% negative.
Hedera (HBAR) Price Statistics:
HBAR price now – $0.1006
HBAR market cap – $2.1 billion
HBAR circulating supply – 20.7 billion
HBAR total supply – 50 billion
Coinmarketcap ranking – #34
HBAR /USD Market
Key Levels:
Resistance levels: $0.13, $0.16, $0.19
Support levels: $0.075, $0.05, $0.025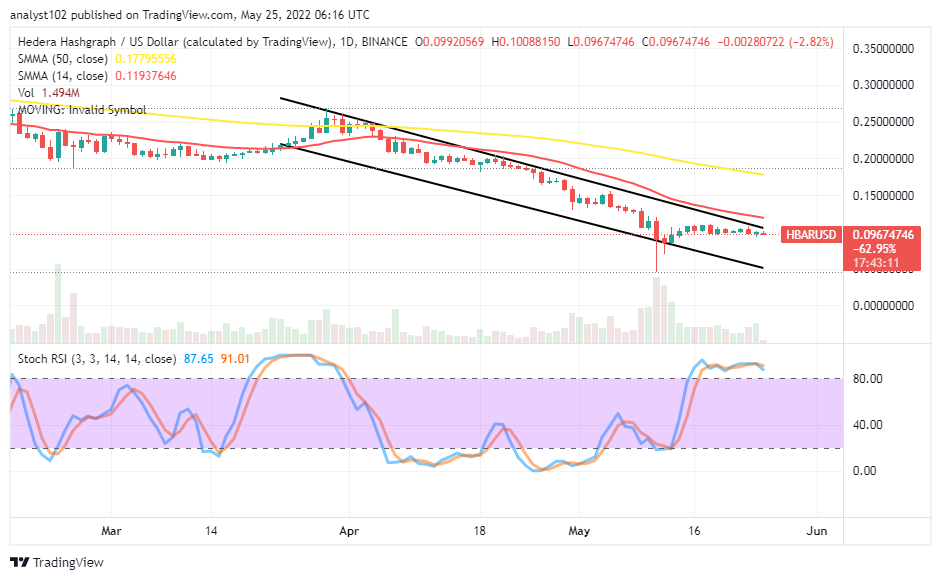 HBAR /USD – Daily Chart
The daily chart showcases the HBAR trade activities may decline more as it ranges around the value line of $0.10 underneath the sell signal side of the smaller SMA. The 50-day SMA trend line is at the top of the 14-day SMA trend line. The upper bearish trend line drew closely beneath the smaller-SMA indicator to show the force to the downside responses to particular psychological resistant-trading points. The Stochastic Oscillators are in the overbought region, trying to cross back southbound.
Will the HBAR/USD market hold firm against declining from around the $0.10 trading line?
The present trading outlook suggests the HBAR market operations may decline more as it ranges against the valuation of the US Dollar. The HBAR/USD market will not hold firmly against a decline from around the $0.10 trading line. Traders intending to execute long orders have to wait patiently to see whether the volatility movement will let the crypto economy go for pull-downs before attempting to swing back northwardly from beneath its current ranging zone to launch a buying order afterward.
On the downside of the technical analysis, the HBAR/USD market is running a range-bound trading outlook capable of suiting a return of downward-trending motion as adjudged by the reading of the Stochastic Oscillators currently. It further signifies lower highs are not visibly making waves to portend the US economy will surrender to a downing force in the long-term run.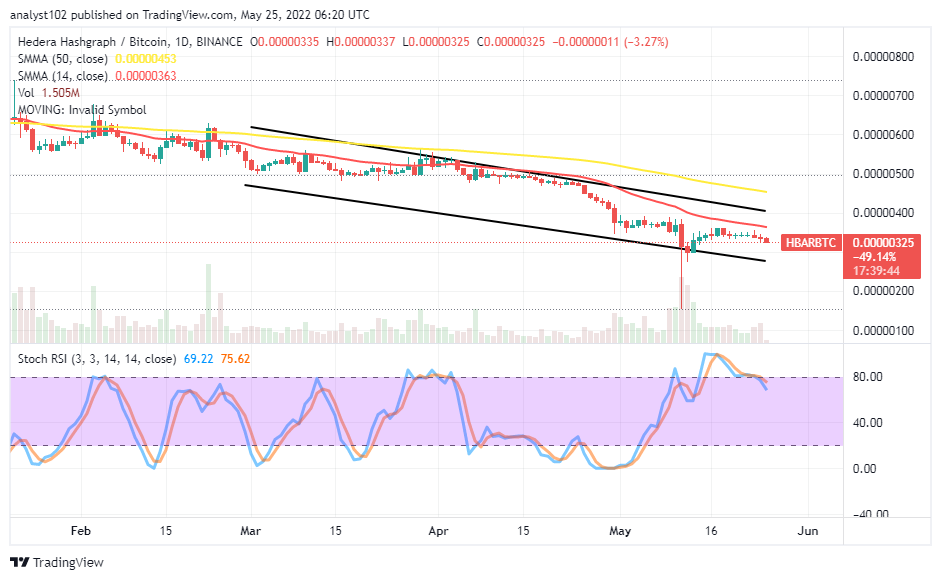
HBAR/BTC Price Analysis
In comparison, there has been a line of futile efforts made by HBAR to stop debasing against the trending worth of BTC over several sessions. The cryptocurrency pair trade may decline more as it ranges below the SMA trend lines. The 14-day SMA indicator is beneath the 50-day SMA indicator. The Stochastic Oscillators show a sign to cross northbound from the overbought region. And a bearish candlestick is in the making to affirm the base crypto is tending to lose a stance to its countering trading crypto soon.
Looking to buy or trade Hedera(HBAR) now? Invest at eToro!
68% of retail investor accounts lose money when trading CFDs with this provider.
Read more:


