The Ethereum price prediction may lose ground towards $1500, but the recovery above $1800 could help to mitigate the initial pressure.
Ethereum Prediction Statistics Data:
- Ethereum price now – $1786
- Ethereum market cap – $215.2 billion
- Ethereum circulating supply – 120.9 million
- Ethereum total supply – 120.9 million
- Ethereum Coinmarketcap ranking – #2
ETH/USD Market
Key Levels:
Resistance levels: $2400, $2600, $2800
Support levels: $1200, $1000, $800
At the time of writing, ETH/USD displays just enough power to defend the support at $1700. All the attempts made towards recovery to prevent the coin from falling below $1800 may bow to the selling activity under the 9-day and 21-day moving averages. Now, the Ethereum price is hovering at $1786 after a loss of 0.21% on the day. In the short term, bearish momentum is very likely especially if the bulls fail to hold the price above $1800 and the nearest support at $1700 may be broken.
Ethereum Price Prediction: What could be the Next Move for ETH?
The Ethereum price would need to rise and break above the 9-day and 21-day moving averages, but if the sellers push lower, traders can expect very strong support at $1500; this could then be followed up with support at $1300. If the bears push further below this support, then additional supports may be located at $1200, $800, and $600.
On the other hand, if the buyers regroup and rebound from the current market value of $1786.89, the first level of resistance lies at $2000. This could then be followed by the resistance levels of $2400, $2600, and $2800 while the Relative Strength Index (14) moves below 40-level to indicate indecision within the market.
When compared with Bitcoin, the Ethereum price keeps trading as the coin moves toward the negative side. ETH/BTC is currently trading at 6124 SAT, as the bulls failed to push the price to the north. However, if the price drop below the lower boundary of the channel, the next support may come at 5500 SAT and below.
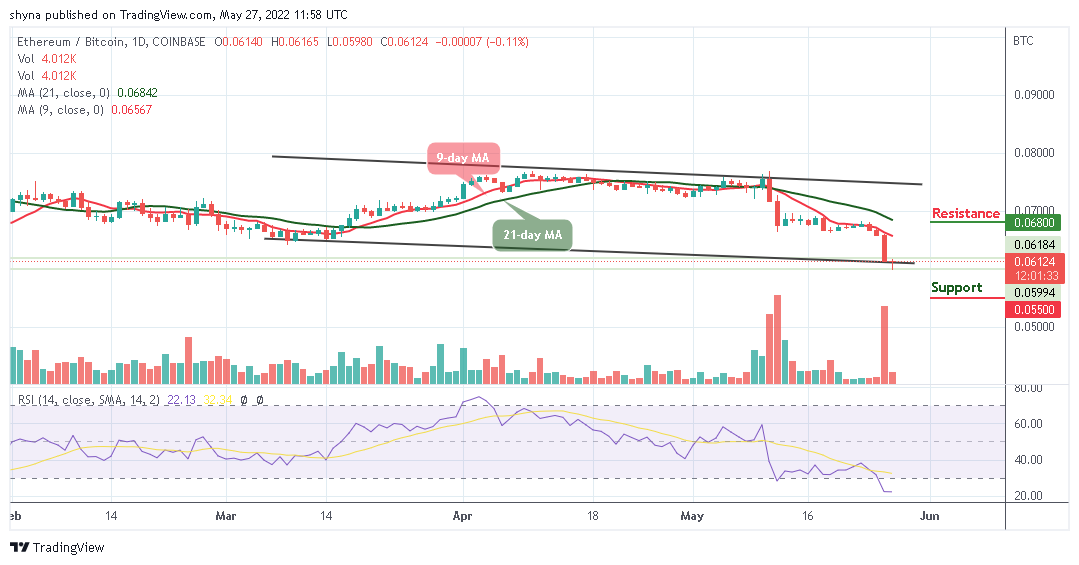
On the contrary, a possible bullish movement could push the market to cross above the 9-day and 21-day moving averages, and a break above this may enable the Ethereum price to reach the resistance level of 6800 SAT and above as the Relative Strength Index (14) is moving within the oversold region to create additional bearish signals.
Ethereum Trader
- 90% Claimed Win Rate*
- $300 Min Deposit
- Accepts credit card and Sofort


