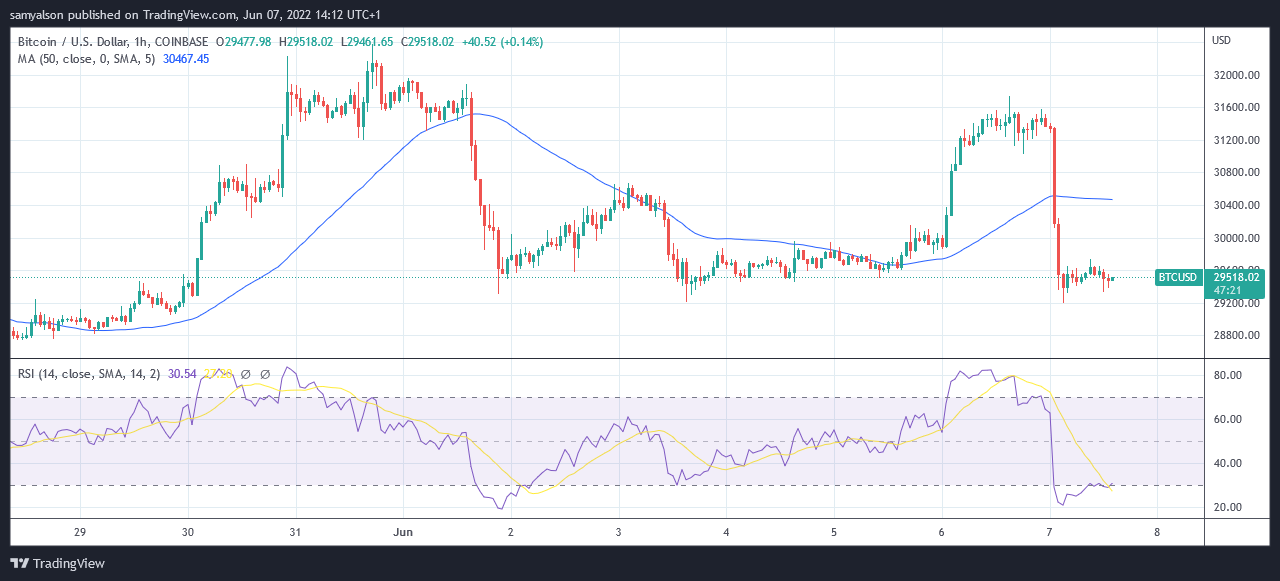
Bears took control at approximately 01:00 (GMT) on June 7 to sink the Bitcoin price. The ensuing sell-off eased at 03:00 (GMT), by which time Bitcoin had lost 7% of its value to bottoming out at $29,200.
This price action takes Bitcoin significantly below the 50-day simple moving average, widely interpreted as a trend change to the downside.
A fight back by bulls was thwarted at 09:00, as evidenced by a long top wick, more significant than the size of the candle body, on the hourly candle.
Since then, a downtrend pattern has formed, and the Relative Strength Index (RSI) is printing a horizontal reading along 30, at the cusp of being classed as oversold.
The price movement has resulted in the formation of a second Bart pattern just a week after the last one concluded at the start of June.
Bitcoin makes the Bart pattern, again
The Bart Simpson pattern is a short-term chart pattern characterized by a sharp rally, usually on a shorter timeframe like 30 minutes or an hour. A period of sideways action occurs, followed by a steep retracement to erase all previous gains.
Trader JamesRkaye said the appearance of the Bart pattern is sometimes associated with institutional manipulation. He warned that manipulators intend to shake down retail traders and have their opposing orders filled.
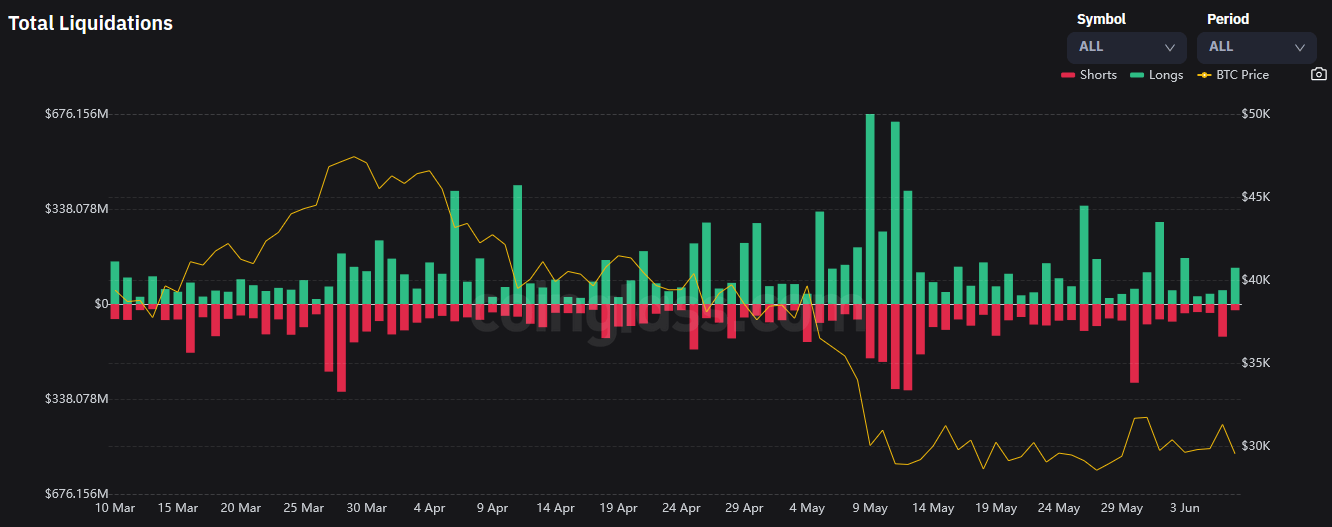
Bitcoin long traders suffered 24-hour liquidations totaling $129.2 million, according to data analytics platform Coinglass. This is significantly less than long liquidations experienced during the last Bart pattern, at $292 million.
What now?
As Bitcoin retook $30,000 at the end of May, a new narrative formed among some investors that crypto winter would be short-lived.
However, Bitcoin is currently significantly below the 50-day moving average and back below $30,000 once more.
@rektcapital commented that the BTC uptrend will resume once the 50-day moving average is recaptured.
However, there is every likelihood that a continuation of selling will drop the price toward the 200-day moving average, which represents “maximum financial opportunity” according to the analyst.
The post Bitcoin prints second ‘Bart’ pattern in a week to bottom at $29,200 appeared first on CryptoSlate.


