The Sandbox (SAND) Price Prediction – July 1
There has been a long-term price ranging closely above the $1 trading line as the base instrument features lower highs. The market’s all-time high is $8.44, and the all-time low is $0.02894. Currently, the price is trading around $1.14 at a 2.24% positive.
The Sandbox Price Statistics:
SAND price now – $1.14
SAND market cap – $1.4 billion
SAND circulating supply – 1,3 billion
SAND total supply – 3 billion
Coinmarketcap ranking – #34
The Sandbox (SAND) Market
Key Levels:
Resistance levels: $1.50, $2, $2.50
Support levels: $1, $0.75, $0.50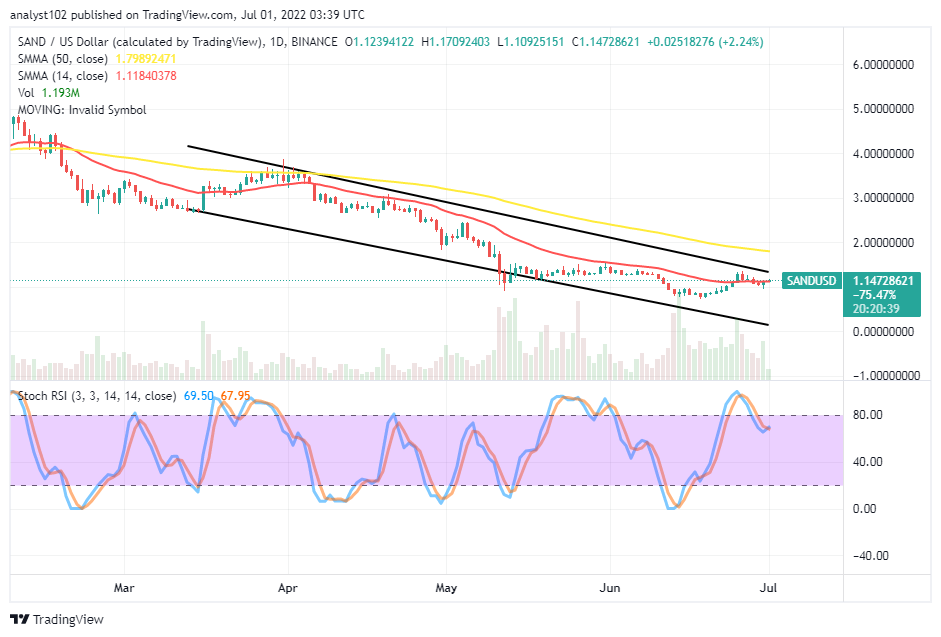 SAND/USD – Daily Chart
The SAND/USD daily chart reveals the trending crypto features lower highs around the trend line of the smaller SMA. The 14-say SMA indicator is underneath the 50-day SMA indicator. The bearish channel trend lines drew to ascertain the importance of the role of the smaller SMA as it keeps somewhat downward within. The Stochastic Oscillators have slightly crossed southbound from the overbought region against the 80 range.
Will the SAND/USD market hold firm in its lower highs featuring?
The current trading outlook portends there can be a feeble correction in the SAND/USD market operations as the crypto economy is featuring lower highs in a lighter-moving mode. Based on that sentiment, long-position takers will have to be alert when there is a re-occurrence of the situation while the price tries to find back support beneath the trend line of the 14-day SMA trading indicator. Nevertheless, investors may consider buying into the crypto economy now.
On the downside of the technical analysis, the SAND/USD market short-position takers to ensure that price doesn’t trade past the resistance zone of $1.79, as indicated by the reading outlook of the 50-day SMA indicator. Traders need to back up their entries with active price actions tending to go downside from over the 14-day SMA trend line. It shows the market may still move in a row of lighter ranges to make a definite direction unclear for some time.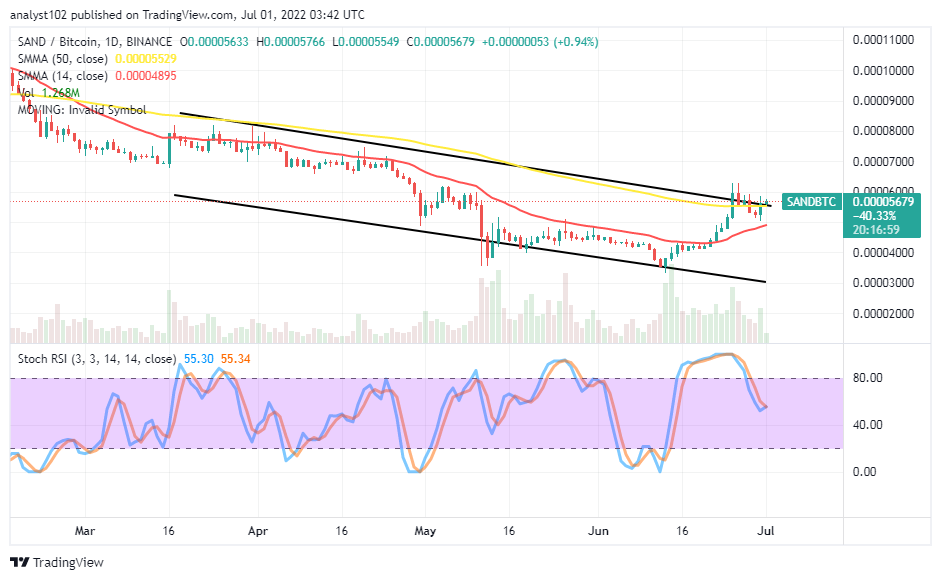
SAND/BTC Price Analysis
The Sandbox has pushed northward for some recoveries against the trending ability of Bitcoin. The 14-day SMA indicator is underneath the 50-day SMA indicator. The bearish upper trend line drew around the bigger SMA. Variant trading candlesticks have converged around the upper SMA to denote rejection signals. The Stochastic Oscillators have crossed southbound from the overbought region. And they are attempting to close at the 55 range point.
Our Recommended Crypto Exchange for U.S. customers
- 120+ Cryptos Wallet Available
- Paypal available
- Licensed and regulated in the U.S.
- Social trading Platform & copy trading
- Low trading fees
Read more:


