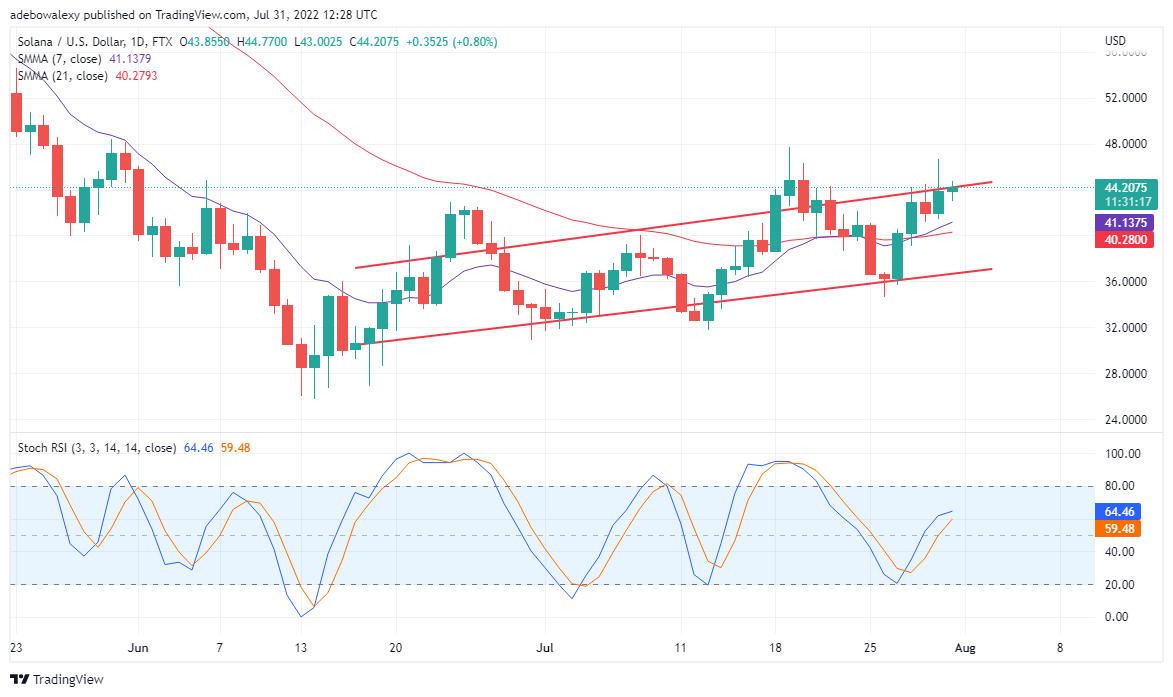
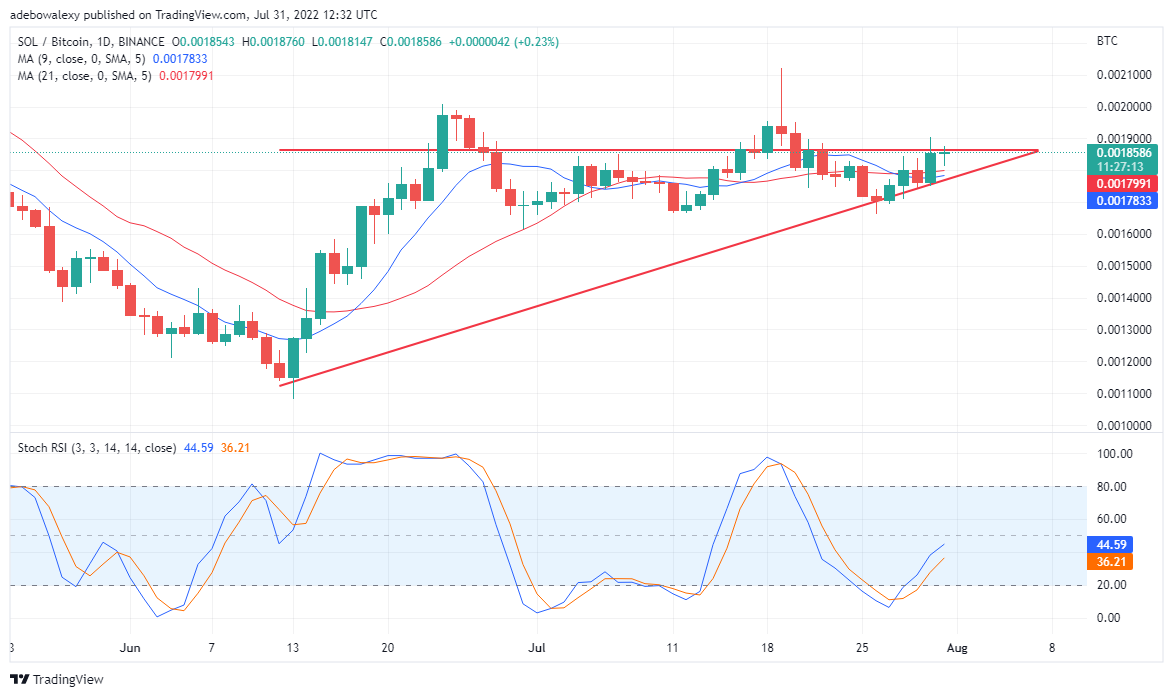
Today’s prediction shows that Solana market is performing better against Bitcoin than the US dollar. In this forecast, it can be observed that this crypto is trying to break upwards. This is seen through the movement of price in the price channel against the USD, and the upward slopping triangle on the SOL/BTC charts.
Binance Coin Forecast Statistics Data:
Solana Coin’s current price – is $44.00
Solana Coin market cap – $15.2 billion
Solana Coin circulating supply – 346.2 million
Solana Coin total supply – 511.6 million
Solana Coin Coinmarketcap ranking – #9
SOL/USD Market
Important Marks:
Resistance levels: $40.00, $42.00, $44.21
Support levels: $43.50, $41.50, $36.70

Also, ever since early July, this SOL has been trading in a slightly upward manner till now. However, let’s take a look at this market and a little of what to expect henceforth.
Solana Coin Value Forecast: SOL Minimal Upward Gain
Considering the SOL/USD daily chart, it can be observed that this crypto has been trading generally in an upward-slopping manner. However, there are some fake-outs at some point, but price movements more consistently maintained the upward sloping channel.
Also, the Stochastic Relative Strength Indicator as well reflects the manner of price movements. We can see that the last downward correction occurred higher up in the overbought region than the one before it. Consequently, this portrays the slightly upward slopping manner of price movements, as seen on the chart. Subsequently, the take from here is that Solana may be more profitable in hourly trading than in longer terms of weekly or monthly trading. Also, the SRSI foretells that another reversal is near as the curves of this Indicator are about to cross each other below the overbought region. Eventually, the value of this crypto may reverse to $45 at most. So traders of this pair can anticipate this level.

Solana Coin Value Forecast: SOL is Showing More Optimism on this Front
Furthermore, on the SOL/BTC chart, this coin is displaying some optimism, as it trades in an upward-slopping triangle. This movement developed on the 13th of June, as the crypto rallied in value till beyond the 20th of June and value reached around 0.00200. Following this trend was a correction that caused the pair to generally range sideways. Nevertheless, the movement pattern of this crypto in the said pattern, suggests that we may witness an upside breakout.
The SRSI indicator throws more light on the upcoming event. This can be seen as the curves of this indicator is rising Upward from the oversold region. Also, looking at the current position of the indicator lines we may assume that the breakout is possible. Consequently, the value of Solana against Bitcoin may reach around 0.00200, and higher support may be found from there.
Battle Infinity – New Crypto Presale
- Presale Until October 2022 – 16500 BNB Hard Cap
- First Fantasy Sports Metaverse Game
- Play to Earn Utility – IBAT Token
- Powered By Unreal Engine
- CoinSniper Verified, Solid Proof Audited
- Roadmap & Whitepaper at battleinfinity.io


