Terra Classic (LUNC) Price Prediction – August 1
The Terra classic market attempts to surge northward high to dowse the effects of the US Dollar in the operations so far. Price is trading at $0.0001138, having witnessed a low of $0.00008631 and a high of $0.0001309 in the last thirty days’ sessions.
Terra Classic (LUNC) Price Statistics:
LUNC price now – $0.0001113
LUNC market cap – $738.5 million
LUNC circulating supply – 6.5 trillion
LUNC total supply – 6.6 trillion
Coinmarketcap ranking – #212
LUNC/USD Market
Key Levels:
Resistance levels: $0.00014, $0.00015, $0.00016
Support levels: $0.00009, $0.00008, $0.00007 LUNC/USD – Lon-term Chart
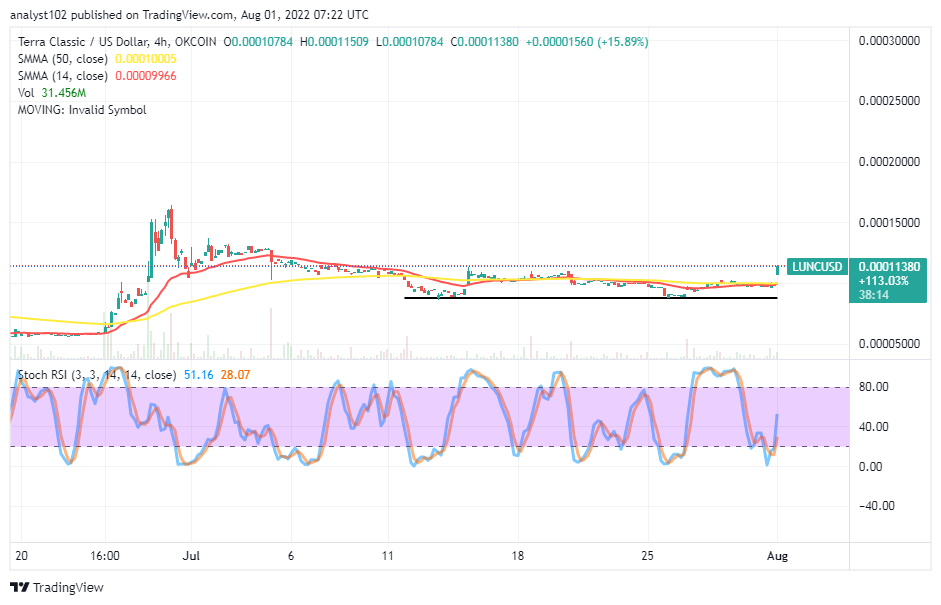
The LUNC/USD long-term chart showcases the crypto-economic price attempts to surge northward high above the trend lines of the SMAs. The 14-day SMA indicator has conjoined with the 50-day SMA indicator. The market trend outlook has been predominantly ranging. The Stochastic Oscillators have recently dipped into the oversold region. But they have now crossed northbound from the zone briefly past the range of 40. And they are still pointing in the upside direction.
Will there be more upsurges in the LUNC/USSD market?
There may be more sustainable upsurges in the LUUNC/USD market in the following operations as it appears the price attempts to surge northward high. The bullish candlestick in the making signifies bulls are on top of the trading situation at the expense of bears’ weaknesses. An emergence of reversal motion against the northward pressures will lead the market back into the range-bound spots.
On the downside of the technical analysis, the current trading situation portends an obscure environment for getting a smooth entry for a sell order. Nevertheless, a fearful reversion of the motion from a higher-trading spot may let the LUNC/USD market bears get repositioned for profiteering by entering a sell order. Short-position players need to be cautious of the late execution of positions at the moment. However, investors may join the trend now before running late.
LUNC/USD Medium Chart
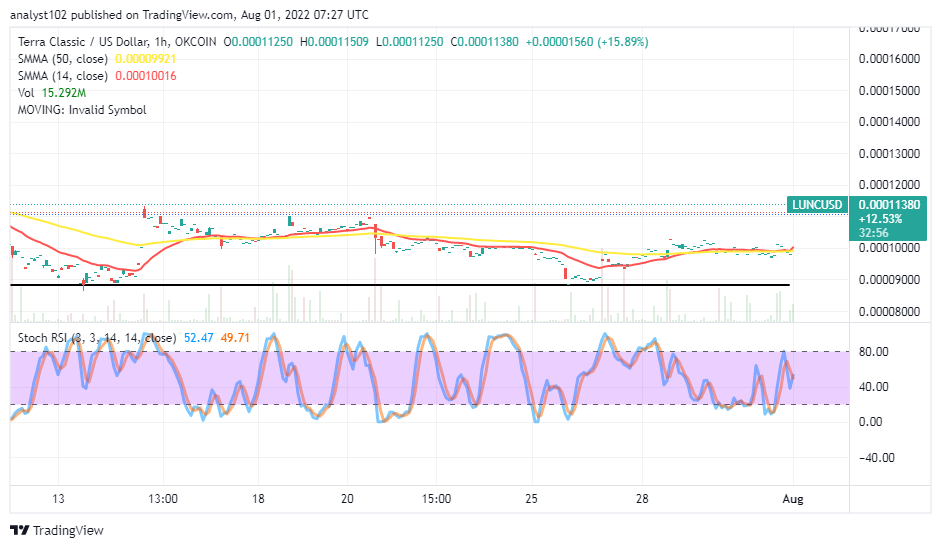
The LUNC/USD medium-term chart shows the crypto economy attempts to surge northward high as the price has gapped to the upside, briefly surpassing some previous highs over the SMAs’ trend lines. The 14-day SMA indicator has joined with the 50-day SMA indicator. And they are still lying flat below the current trading spot. The Stochastic Oscillators have briefly crossed southbound within the ranges of 80 and 40. And they now seem to close their lines to signify a pause may thrive in the activities for a while before resuming the next definite direction.
Battle Infinity – New Crypto Presale
- Presale Until October 2022 – 16500 BNB Hard Cap
- First Fantasy Sports Metaverse Game
- Play to Earn Utility – IBAT Token
- Powered By Unreal Engine
- CoinSniper Verified, Solid Proof Audited
- Roadmap & Whitepaper at battleinfinity.io
Read more:


