Ethereum saw a major rejection near the $1,420 zone against the US Dollar. ETH is down over 6% and remains at a risk of a drop below the $1,220 support.
- Ethereum started a fresh decline from the $1,420 resistance zone.
- The price is now trading below $1,300 and the 100 hourly simple moving average.
- There was a break below a key bullish trend line with support near $1,325 on the hourly chart of ETH/USD (data feed via Kraken).
- The pair could recover, but it might face sellers near the $1,285 and $1,325 levels.
Ethereum Price Dives 6%
Ethereum attempted to gain bullish momentum above the $1,400 level. However, ETH struggled to clear the $1,420 level and reacted sharply to the downside.
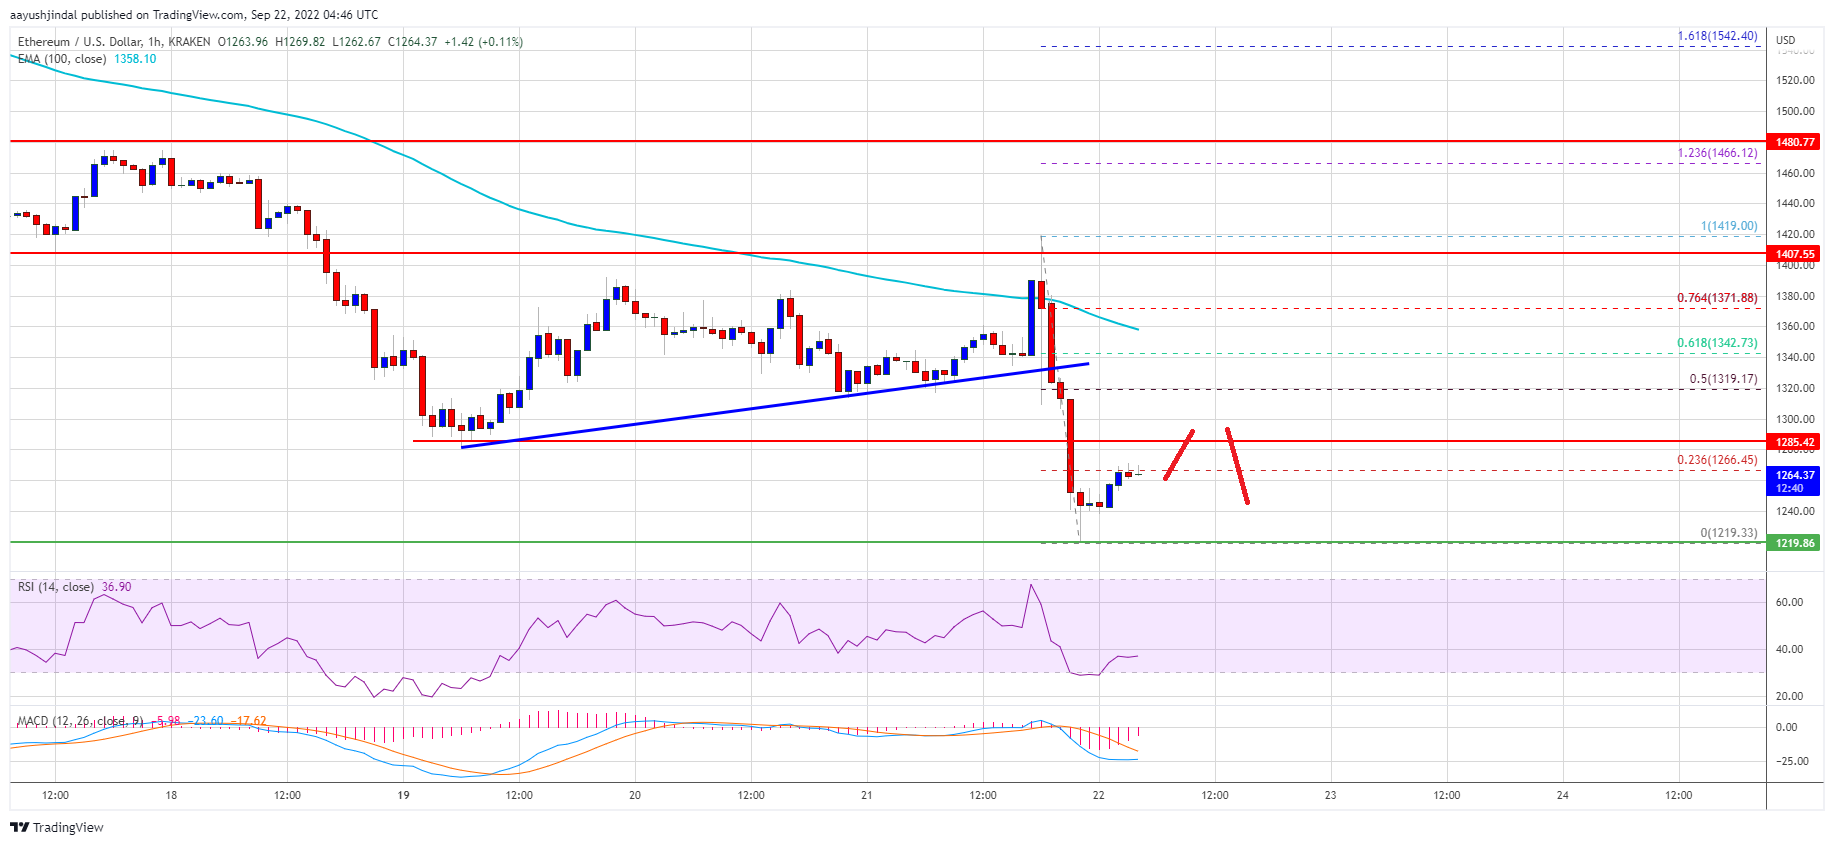
There was a major decline below the $1,350 and $1,320 levels. Besides, there was a break below a key bullish trend line with support near $1,325 on the hourly chart of ETH/USD. The pair even broke the $1,300 level and settled well below the 100 hourly simple moving average.
Ether price traded to a new weekly low at $1,219 and is currently consolidating losses. It is testing the 23.6% Fib retracement level of the recent decline from the $1,419 swing high to $1,219 low.
On the upside, the price is facing resistance near the $1,285 level. The next major resistance is near $1,320 level. It is close to the 50% Fib retracement level of the recent decline from the $1,419 swing high to $1,219 low. The main resistance sits near the $1,350 level and the 100 hourly SMA.
Source: ETHUSD on TradingView.com
A clear break above $1,350 might start a decent increase towards the $1,420 level. Any more gains may perhaps open the doors for a move towards the $1,500 resistance.
More Losses in ETH?
If ethereum fails to recover above the $1,320 resistance, it could continue to move down. An initial support on the downside is near the $1,240 zone.
The next major support is near $1,220. A downside break below the $1,220 support might spark another sharp decline. In the stated case, ether price might drop towards the $1,150 level in the near term.
Technical Indicators
Hourly MACD – The MACD for ETH/USD is now losing momentum in the bearish zone.
Hourly RSI – The RSI for ETH/USD is now below the 50 level.
Major Support Level – $1,220
Major Resistance Level – $1,320


