AAVE price started a major increase from the $65 support zone. It is up nearly 20% this week and might extend gains above the $85 resistance.
- AAVE price gained pace after it surpassed the $75 resistance against the US dollar.
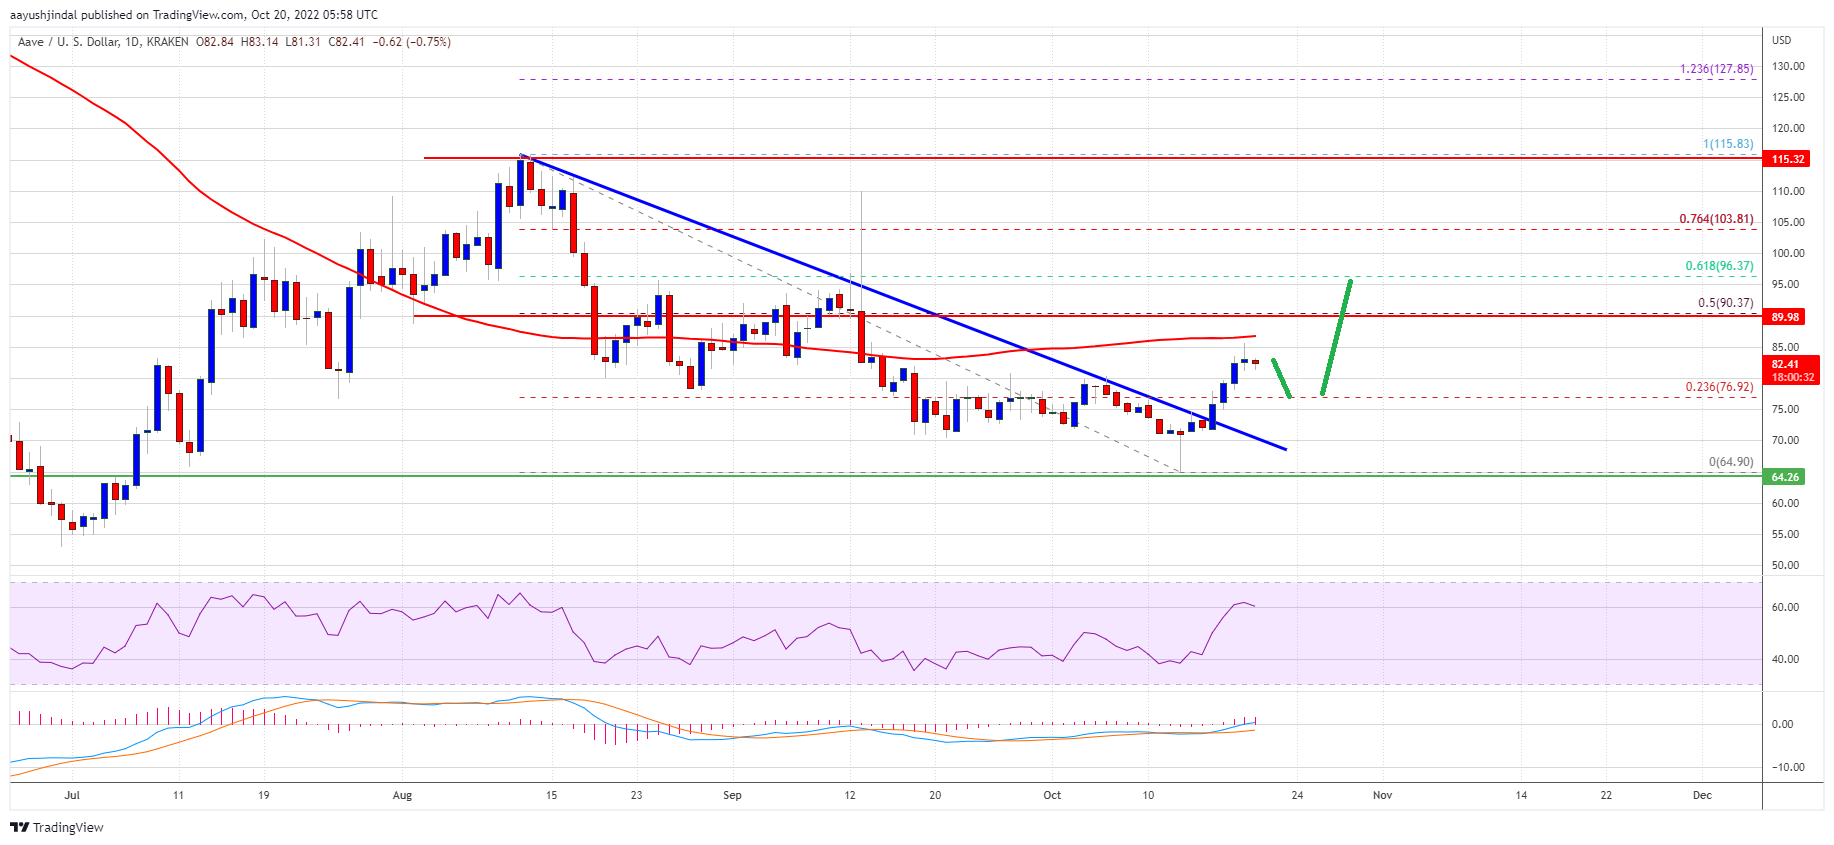
- The price is trading below $85 and the 100-day simple moving average.
- There was a break above a major bearish trend line with resistance at $75 on the daily chart of the AAVE/USD pair (data source from Kraken).
- The pair could continue to rise and might soon test the $100 resistance zone.
AAVE Price Starts Fresh Increase
After a steady decline, AAVE price found support near the $65 zone. The price formed a base above the $65 level and started a steady increase.
There was a clear move above the $72 and $75 resistance levels. The price climbed above the 23.6% Fib retracement level of the downward move from the $116 swing high to $65 low. Besides, there was a break above a major bearish trend line with resistance at $75 on the daily chart of the AAVE/USD pair.
The price is now trading near the $85 resistance and the 100-day simple moving average. It is also showing positive signs, outperforming bitcoin and ethereum.
Source: AAVEUSD on TradingView.com
On the upside, an immediate resistance is near the $85 zone. The next major resistance is forming near the $90 zone. It is close to the 50% Fib retracement level of the downward move from the $116 swing high to $65 low. If there is an upside break above the $95 and $100 levels, the price could surge over 10%. In the stated case, the price could rise steadily towards the $100 level.
Dips Limited in AAVE?
If AAVE price fails to continue higher above the $85 or $90 levels, it could start a downside correction. An immediate support on the downside is near the $80 level.
The main support is near the $75 zone. A downside break below the $75 level could open the doors for a fresh decline towards $70. The next major support is near the $65 level.
Technical Indicators
Daily MACD – The MACD for AAVE/USD is slowly losing momentum in the bullish zone.
Daily RSI (Relative Strength Index) – The RSI for AAVE/USD is now above the 50 level.
Major Support Levels – $80 and $75.
Major Resistance Levels – $85, $90 and $100.


