One of the many ways to analyze the crypto market is to compare the performance of its segments. For the sake of simplicity, leading, large-cap ecosystems like Bitcoin (BTC) and Ethereum (ETH) can be seen as a single segment of the market whose movements can be significantly different from the rest of the market.
Meanwhile, the rest of the market can be defined as “altcoins” because their performance has historically shown a lower correlation to BTC and ETH.
Out of the many tools available to analyze these segments, the alts signal stands out as a leading one. Developed as an oscillator, similar to traditional tools like the RSI, the alts signal offers a granular view by comparing the market cap of all cryptocurrencies, excluding BTC and ETH, to the total crypto market cap.
As it moves within a range of 0 to 1, the signal provides insight into the relative performance of altcoins against the broader market, serving as a barometer for their strengths or weaknesses.
The signal’s utility lies in its ability to define specific market scenarios. Each scenario shows different market conditions and opens up potential strategies for traders and investors. These scenarios range from bullish to bearish.
In the first scenario, both BTC and the alts signal are rising, indicating a clear uptrend where both segments are growing. Typically, this occurs when Bitcoin’s dominance is stable or declining, which signals a broad-based bull rally across the market.
In this scenario, investors usually consider increasing their positions in altcoins, especially if the alts signal rises more sharply than BTC — suggesting stronger performance in the altcoin sector.
In the second scenario, both BTC and the alts signal are declining, indicating a clear downtrend across the entire market. In this situation, investors usually look to de-risk by reallocating to stablecoins or “blue chip” cryptocurrencies, further contributing to the downturn.
The third scenario sees BTC declining while the alts signal is rising. This is less common and occurs when Bitcoin loses value, but altcoins outperform BTC. This might indicate a short alt season, where investors often increase exposure to altcoins, provided Bitcoin’s decline is not too steep.
Bitcoin rising and the alts signal declining is the fourth scenario, which occurs if Bitcoin is outperforming the broader market, often observed either before a halving event or at the beginning of a bull market.
Although the overall market is increasing in dollar terms, Bitcoin is gaining value faster than altcoins. This scenario has historically been a good time to accumulate altcoins, as a large part of the market is anticipating a delayed rally.
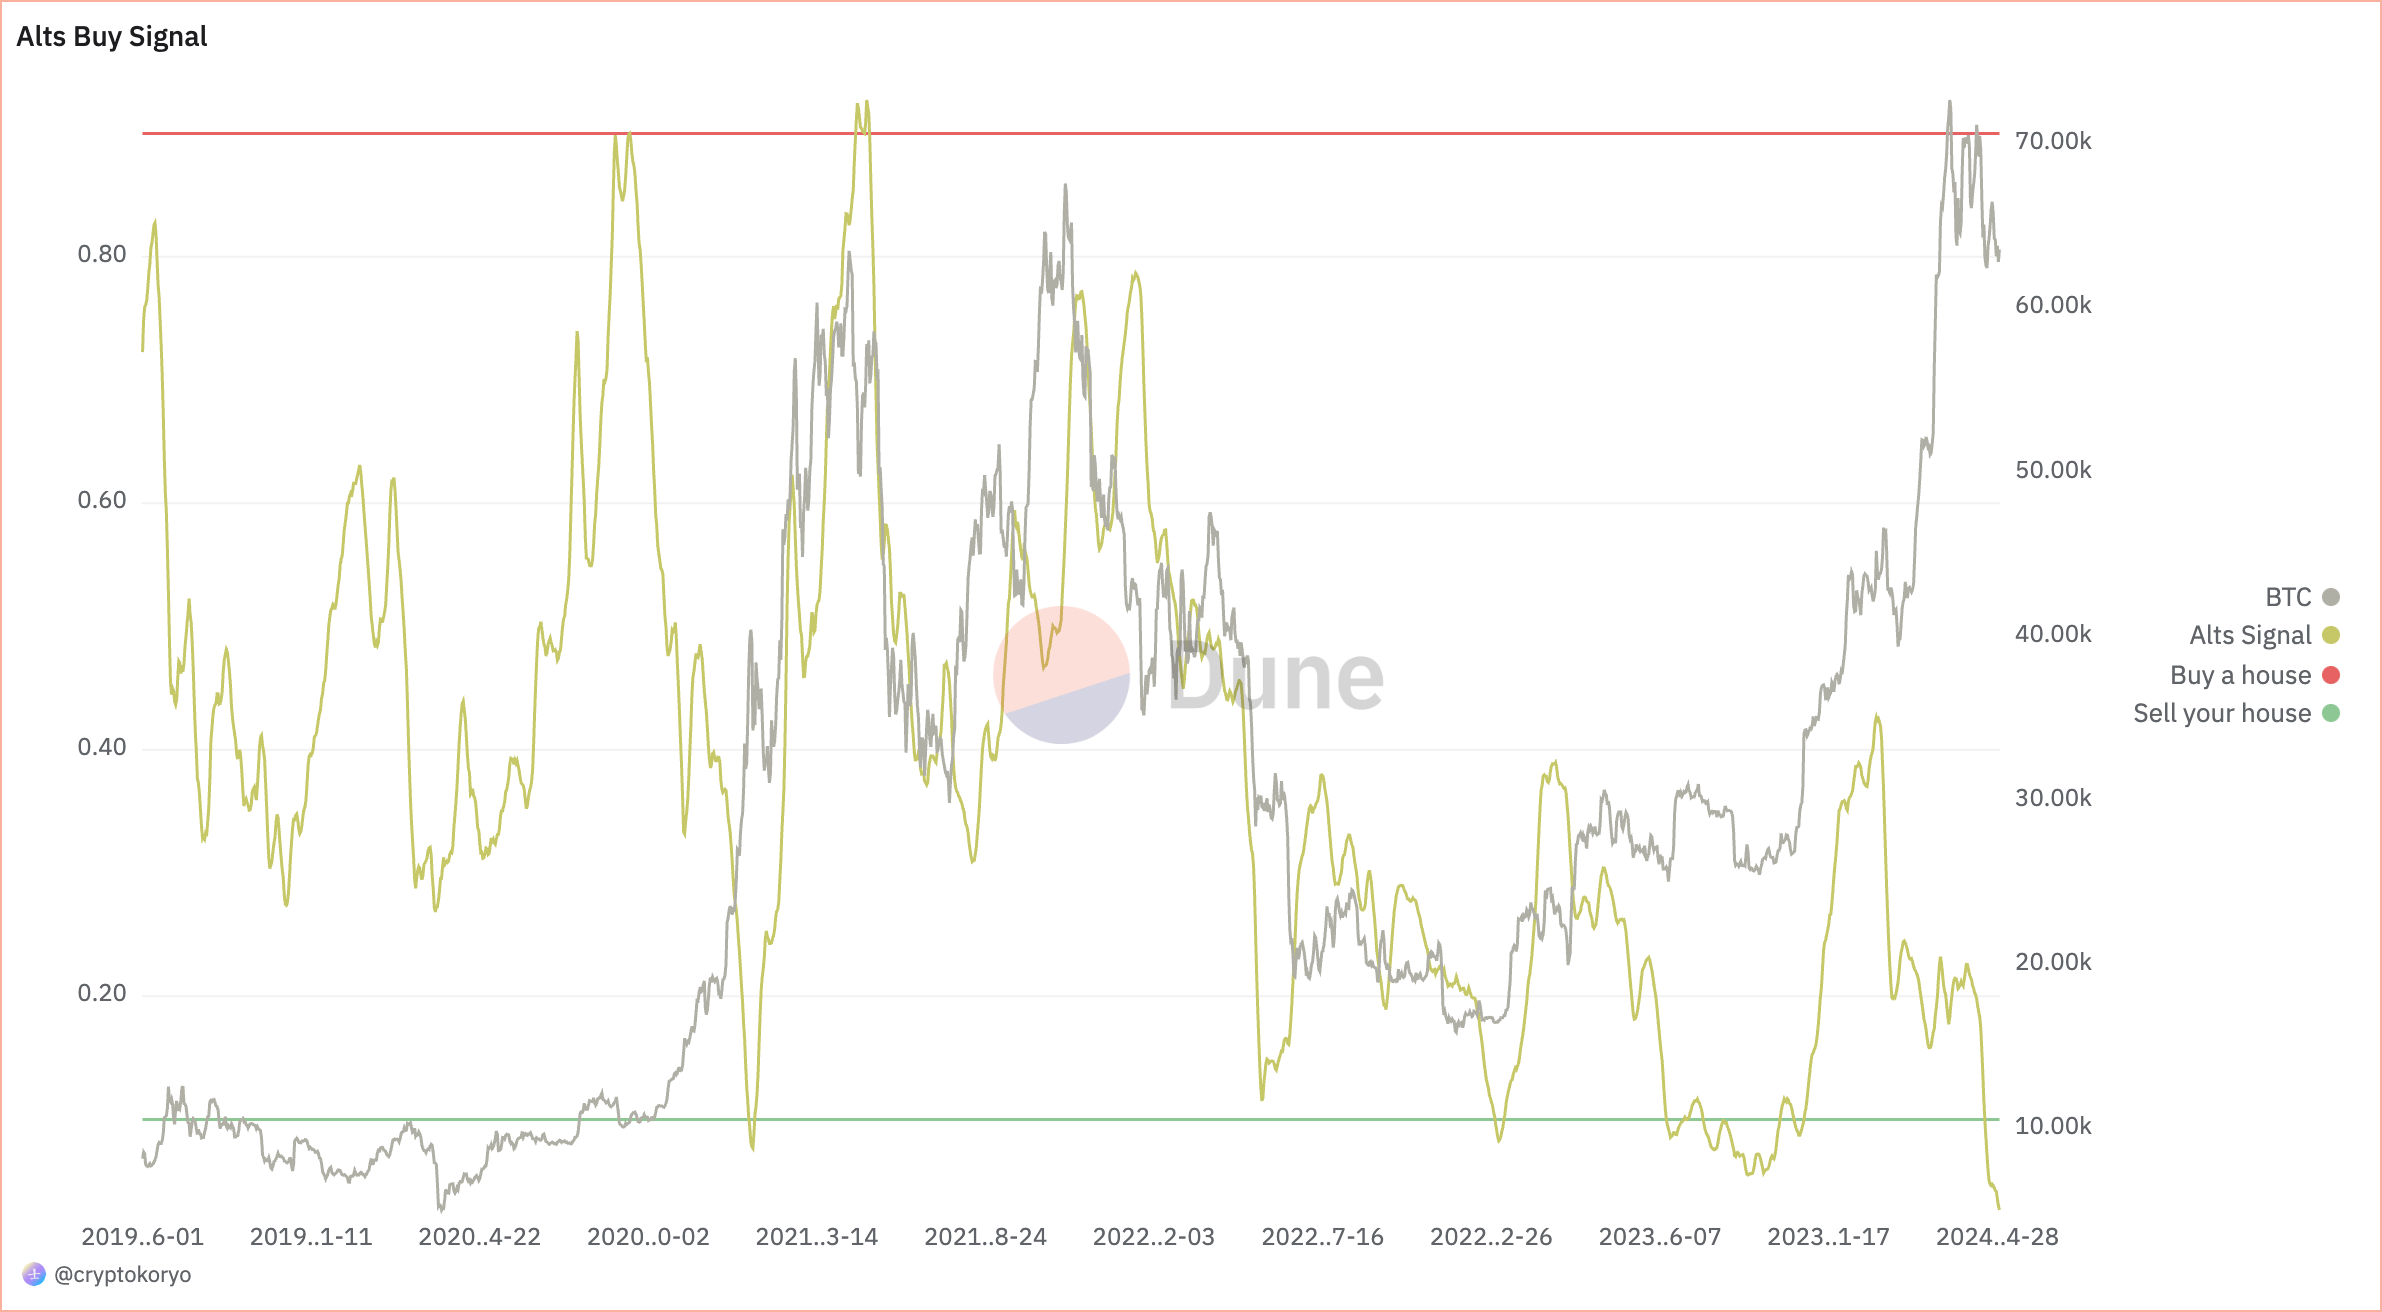
Since the beginning of the year, the alts signal saw significant volatility. Starting at 0.4230, it initially showed a strong position but dropped sharply to 0.1991 by mid-January and further to 0.1599 by late February, indicating a shift towards the accumulation zone.
By late March, the signal partially recovered to 0.2193, only to plummet to a generational buy level of 0.0301 by the end of April. This pattern suggests that while the market began relatively healthy, investors gradually moved toward heavy accumulation, indicating potential undervaluation or market apprehension.
In contrast, Bitcoin’s price action during the same period tells a somewhat different story. Its price action aligns perfectly with the fourth scenario, where it outperforms altcoins even as both segments generally rise in dollar terms. This scenario typically indicates a pre-bull market phase where Bitcoin leads a general upturn, but altcoins have yet to fully participate in the rally.
As Bitcoin saw its price rise this year with institutional adoption driven by ETFs and the halving, altcoins have not kept pace. This shows potential for a brewing period where altcoins are poised for significant movements once the market sentiment shifts more favorably toward them. Historically, this pattern has resulted in the buildup of a more explosive altcoin market rally.
The alts signal is currently deep in the generational buy zone, standing below 0.1.
According to data from Dune Analytics developed by analyst @cryptokoryo, this has historically been a good opportunity to accumulate altcoins, with the expectation that their prices will eventually rally to reflect the broader market gains.
The post Alts signal hits new low, hinting at a potential altcoin rally appeared first on CryptoSlate.


