The post ARB Price Analysis: Will $1 Breakout Push Arbitrum to $1.86? appeared first on Coinpedia Fintech News
Despite the price of Bitcoin dropping to $92k levels, the ARB price trend continues a rounding reversal. The bullish trend in the Arbitrum is heading to cross the $1 milestone shortly.
Amid the increasing upside potential, a breakout rally targets the $1.86 mark. Find out more in the ARB price analysis below.
Arbitrum (ARB) Price Performance
In the daily chart, the ARB price action shows a rounding bottom reversal gaining momentum. The ongoing recovery rally, starting from $0.4598, has increased by nearly 100% over the past three weeks.
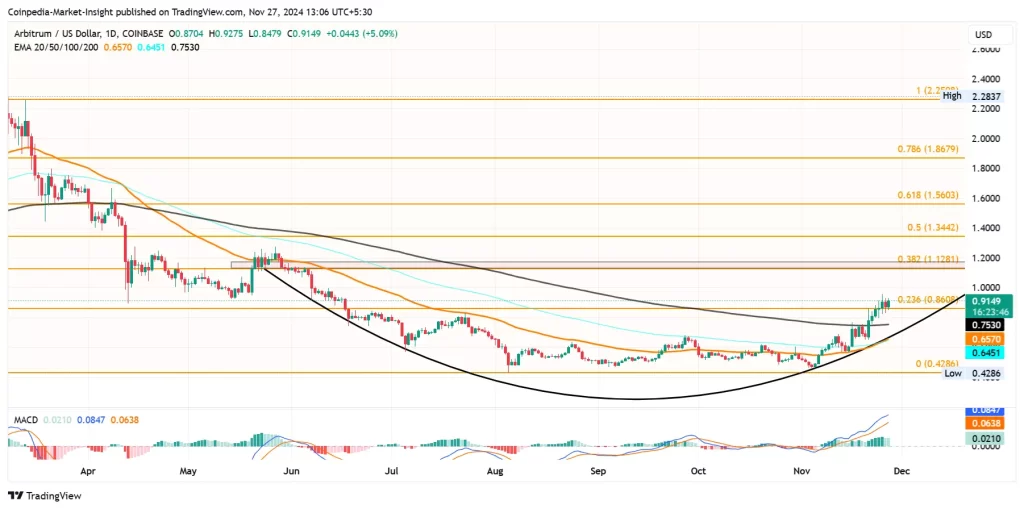
Currently, it is trading at $0.91, with an intraday gain of 4.87%. This creates a bullish engulfing candle and undermines last night’s fall of 3.83%. Currently, the ARB price trend showcases a sideways trend slightly above the 23.60% Fibonacci level.
This crucial support level is priced at $0.8608. As the bullish trend gains momentum, the immediate price target stands at 38.20% Fibonacci level at $1.12.
The crucial resistance coincides with the neckline of the rounding bottom pattern. Furthermore, a resistance zone extending from $1.13 to $1.17 stands slightly above the Fibonacci level. Hence, the ongoing rally is approaching a massive overhead supply.
Technical Indicators:
EMA: The recovery rally has surpassed the 200-day EMA, resulting in a bullish crossover in the 50- and 100-day EMA lines.
MACD: The MACD and signal lines maintain an impressive positive trend with a gradual surge in bullish histograms.
Will Arbitrum Price Hit $250?
If the ARB price crosses the $1 psychological mark, it will fuel the underlying bullish sentiments, resulting in a surge of trend momentum. Furthermore, the broader market recovery will increase the chances of a breakout rally in the ARB price trend.
Based on the Fibonacci levels, the bullish breakout of the rounding bottom pattern could reach $1.86 or the 78.60% Fibonacci level. Conversely, a drop below $0.86 will retest the 200-day EMA at $0.75, followed by the next support at the 50-day EMA at $0.65.
Curious about Arbitrum’s future? Read our Arbitrum (ARB) Price Prediction for an overview of long-term targets!
FAQs
The recent ARB price recovery is driven by a rounding bottom reversal pattern, bullish EMA crossovers, and a breakthrough above critical Fibonacci levels.
The main resistance levels for ARB are the 38.20% Fibonacci level at $1.12 and the resistance zone ranging from $1.13 to $1.17, which aligns with the rounding bottom neckline.
A decline below the vital support at $0.86 or the 200-day EMA at $0.75 could undermine the bullish trend and lead to a bearish reversal.


