Menu

Categories:

Hot right now:

Follow on:

Coinsurges provides coverage of fintech, blockchain, and Bitcoin, delivering the most recent news and analyses on the future of money. Stay up-to-date with live prices, charts, and trading options for the top exchanges. Keep track of the day's top cryptocurrency gainers and losers, as well as which coins have experienced gains and losses in the past 24 hours.
Trust Coinsurges as your go-to source for all news and updates in the industry.

Behind The Mantra (OM) Collapse: Glassnode Reveals The On-Chain Side Of Things

Share This Post

Mantra has just gone through a crash that has wiped out most of its value. Here’s how on-chain metrics have changed during this collapse.

Mantra Has Seen A Reaction In Several On-Chain Indicators

In a new post on X, the on-chain analytics firm Glassnode has discussed about the sudden price plunge that Mantra saw in the past day. During this crash, the asset’s value went from above $6 to around $0.50 in the matter of a few hours.

First, here is how the Exchange Inflow (that is, the total amount of OM being transferred to centralized exchanges) changed along with this volatile move:

Mantra Exchange Inflow

As displayed in the above graph, Mantra interestingly didn’t see any large spikes in the indicator in the leadup to the crash. Investors use exchanges for selling-related purposes, so large deposits tend to appear before intense volatility.

In OM’s case, though, it seems there were no such inflows. Large deposits have still occurred in the past day, but they only came after the collapse was already over. These late inflows likely corresponded to reactionary moves from the investors.

The opposite indicator, the Exchange Outflow, also saw spikes following the price plummet, as the below chart shows.

Mantra Exchange Outflow

While the largest withdrawals only came after the crash was over, there were some significant outflows also made before the low was reached. “This could reflect withdrawals post-liquidation, opportunistic buys followed by self-custody, or exchanges reducing exposure,” explains the analytics firm.

A metric that did register a change ahead of time was the percentage of the Mantra supply held by the top 1% addresses.

Mantra Whales

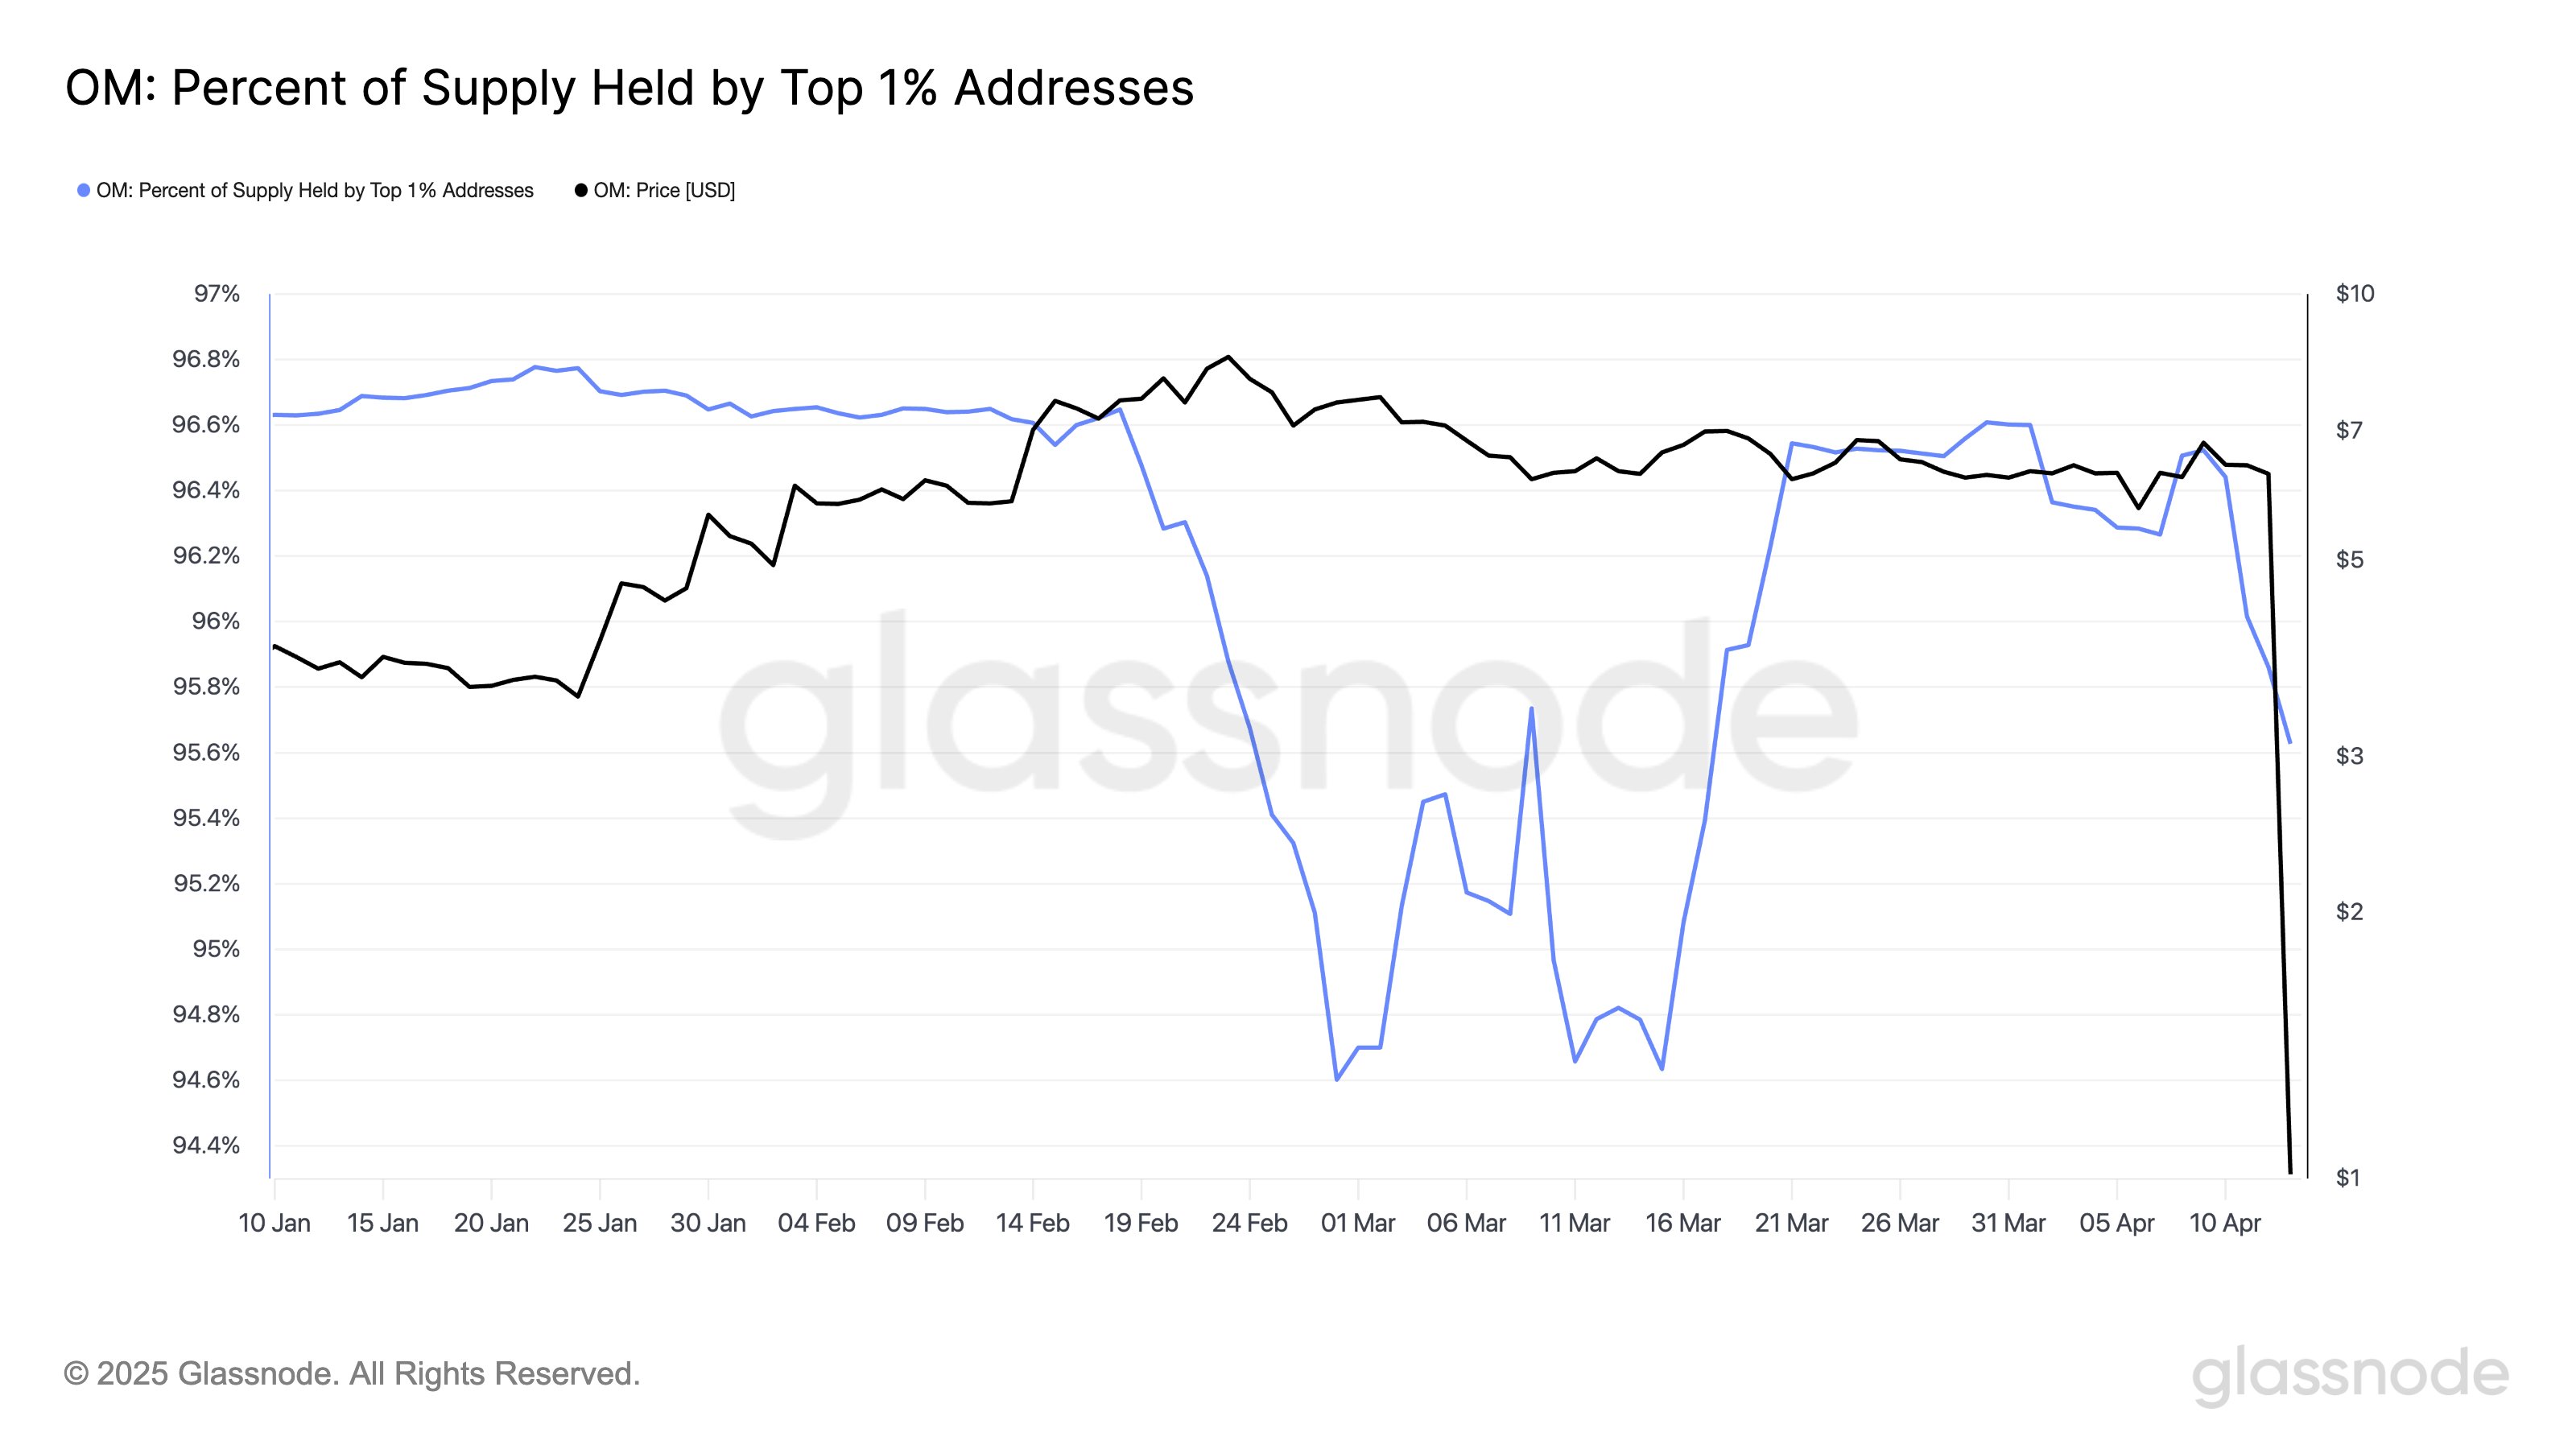
The top 1% addresses reduced their supply share from 96.4% to 95.6% before the OM collapse took place. “While not the largest drop in recent months, it’s notable,” notes Glassnode.

Another indicator that showcases the market panic is the Number of Transfers, which observed a huge spike as OM went through its volatility.

OM Number of Transfers

The Number of Transfers peaked at around 1,400 inside a 10-minute window. Given the scale involved, it’s likely that a large amount of traders were responsible for these moves.

And indeed, the trend in the Active Addresses, a metric keeping track of the number of addresses becoming involved in transactions on the chain, would confirm this.

OM Number of Active Addresses

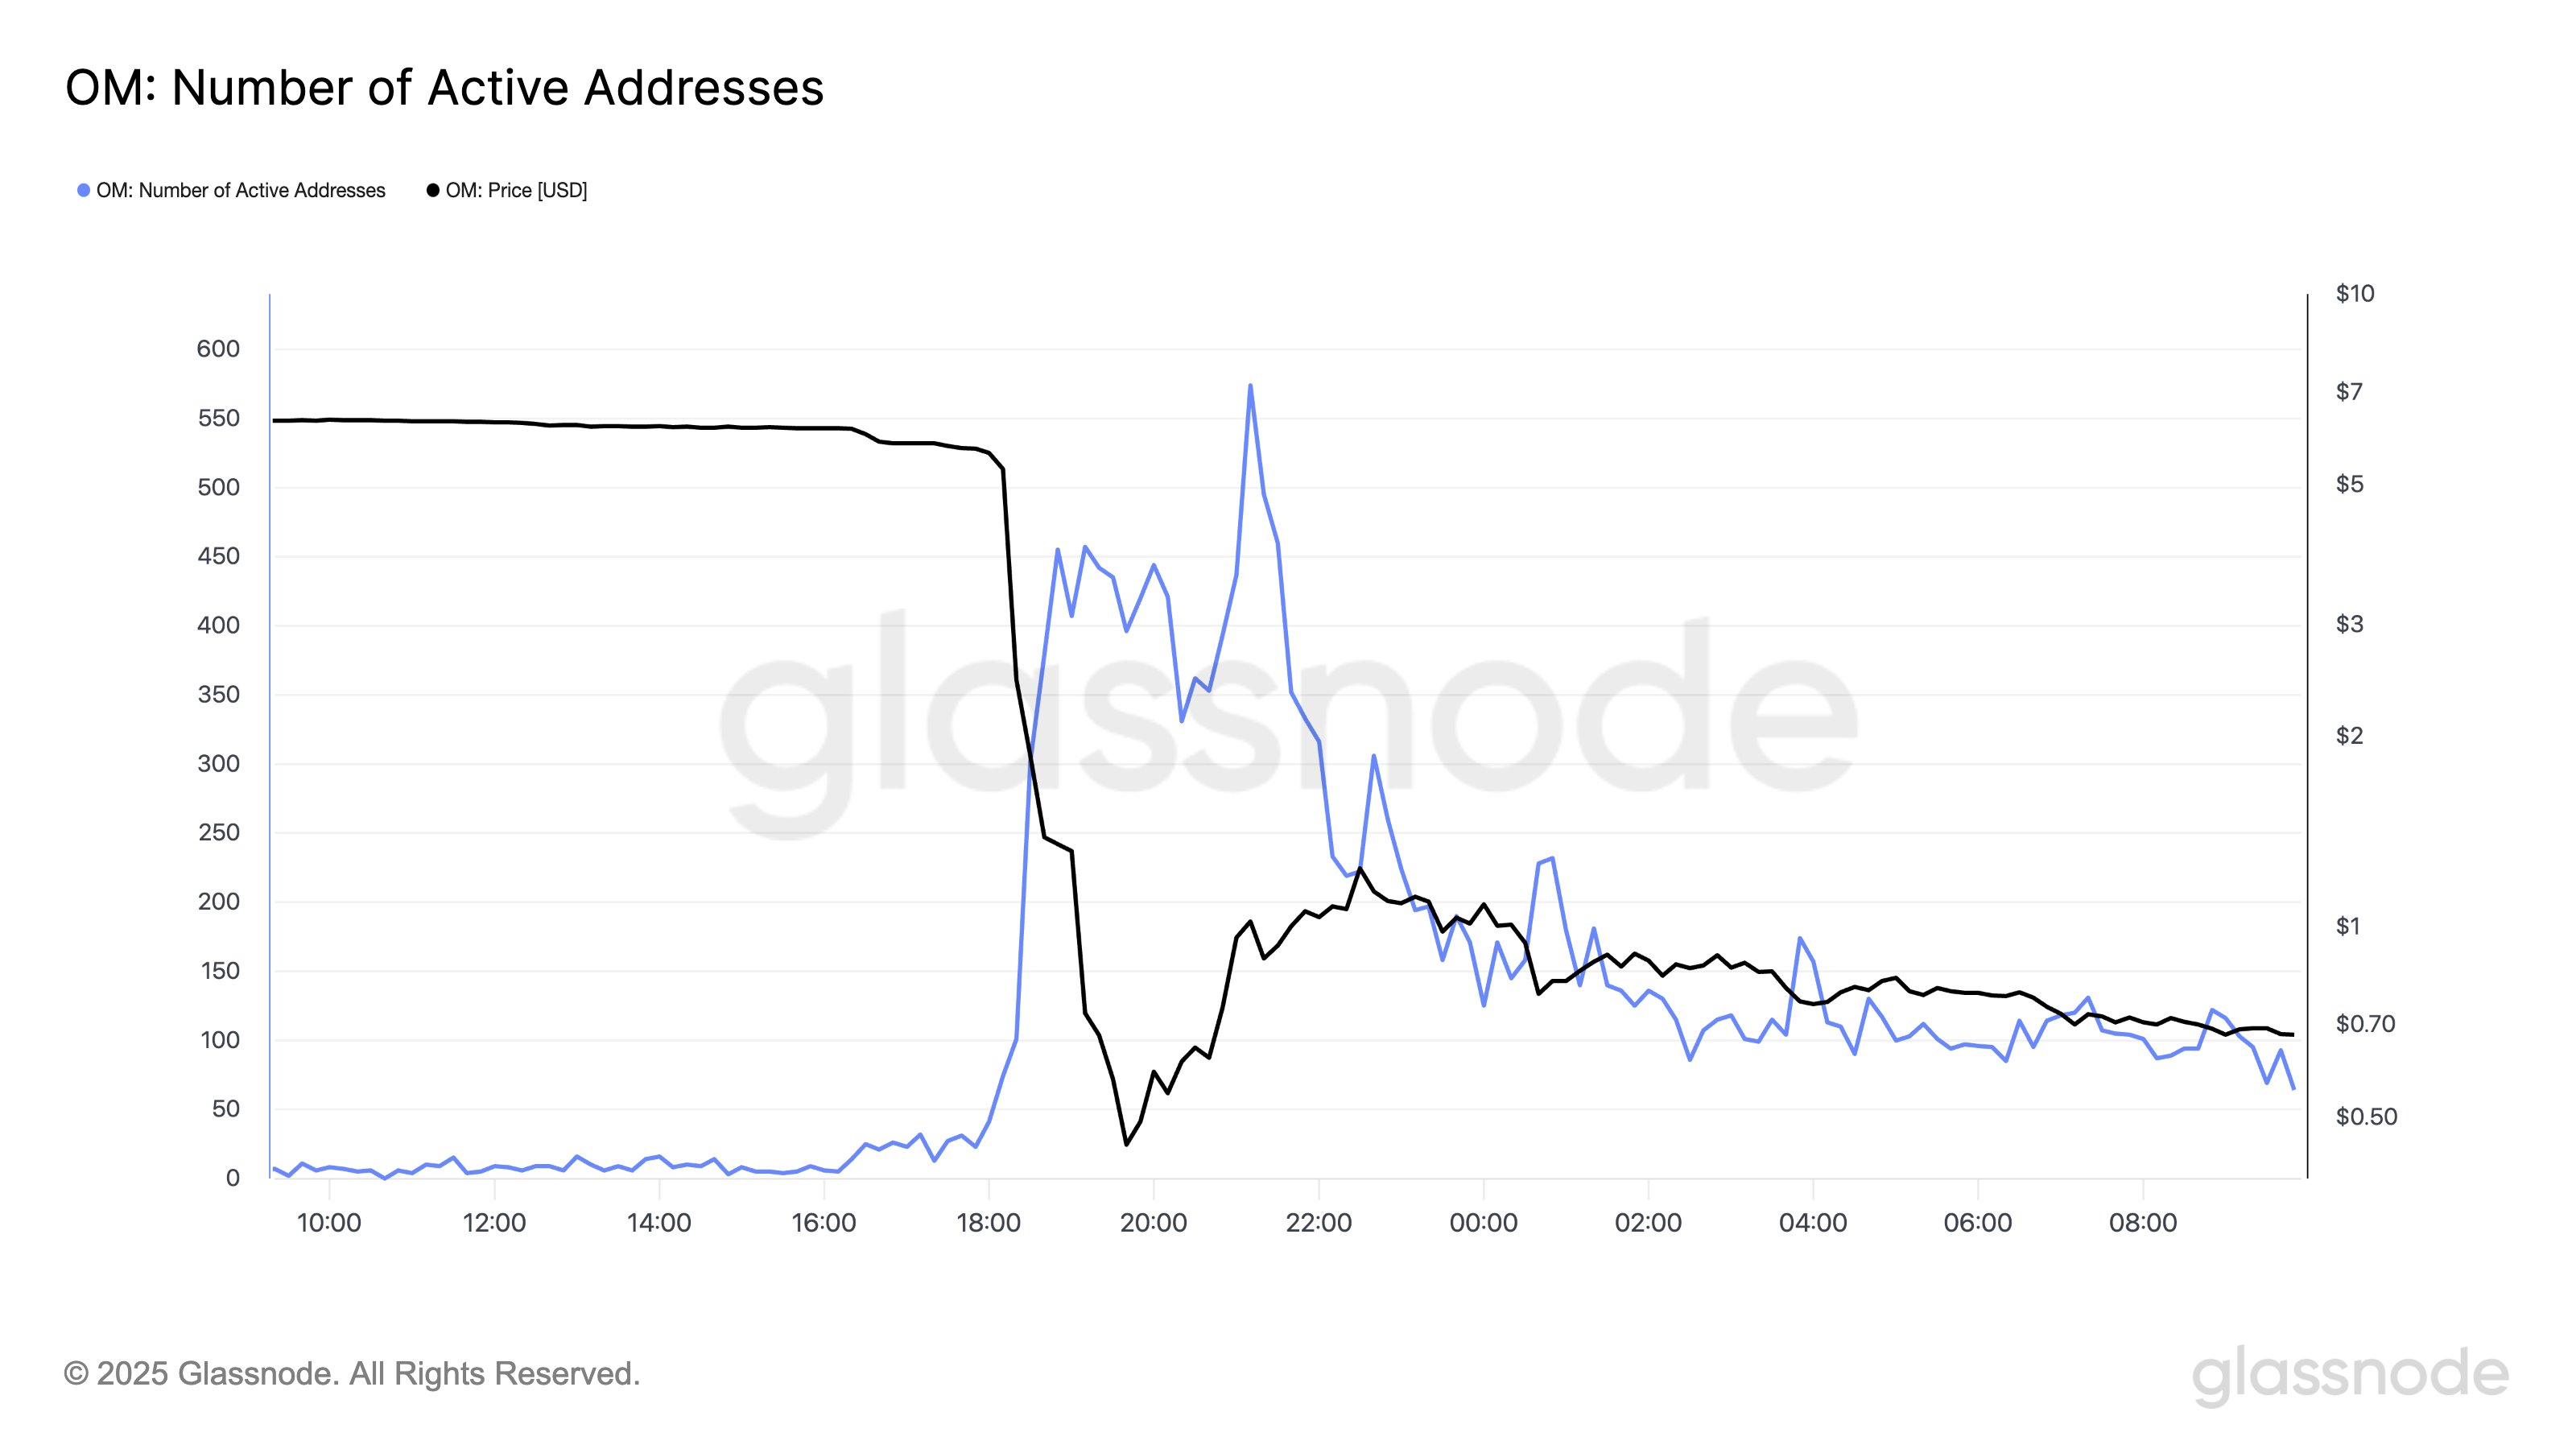
From the chart, it’s apparent that the Active Addresses mimicked the trend in the Number of Transfers very closely, so the Mantra selloff wasn’t contained to a few addresses at all.

OM Price

At the time of writing, Mantra is trading around $0.50, down more than 91% in the past day.

Mantra Price Chart

Read Entire Article
spot_img
- Advertisement -spot_img

Related Posts

Bitcoin Metrics on Binance Show Shift That Could Precede Market Squeeze

Bitcoin has seen a modest decline in price after climbing above $94,000 earlier in the week At the time of writing, BTC is trading at $92,775, reflecting a 13% decrease over the past 24 hours The

How a New Pi Coin Seller is Listing 3 Coins for $314,159 Each on OKX

The post How a New Pi Coin Seller is Listing 3 Coins for $314,159 Each on OKX appeared first on Coinpedia Fintech News Pi Coin (PI) is currently trading at $065, up slightly by more than 1% at the

Trezor Integrates 1inch Fusion for Gasless Crypto Swaps

Trezor has integrated 1inch Fusion into its Trezor Suite platform, enabling gasless and MEV-protected cryptocurrency swaps Trezor Users Gain Gasless Token Swaps with 1inch Fusion The Trezor

Bitcoin crowdfunding platform Geyser launches social-gated launchpad for Bitcoin projects

Bitcoin-native crowdfunding platform Geyser introduced a Bitcoin Launchpad, a new mechanism designed to gate campaign access through community engagement thresholds rather than immediate fundraising

PEPE Price Prediction 2025, 2026 – 2030: Can Pepe Memecoin Reach 1 Cent?

The post PEPE Price Prediction 2025, 2026 – 2030: Can Pepe Memecoin Reach 1 Cent appeared first on Coinpedia Fintech News Story Highlights The live price of the PEPE meme coin is Pepe coin

Philippine Blockchain Week 2025 and Its Mission to Debunk Crypto Myths and Spotlight Real-World Innovation

This content is provided by a sponsor PRESS RELEASE Manila, Philippines – The global conversation around blockchain and cryptocurrencies continues to evolve An industry challenged by myths and