The Binance Coin price prediction may find a halt at $350 as the price is down by 0.71% after touching the daily high of $380.
BNB/USD Market
Key Levels:
Resistance levels: $425, $435, $445
Support levels: $330, $320, $310
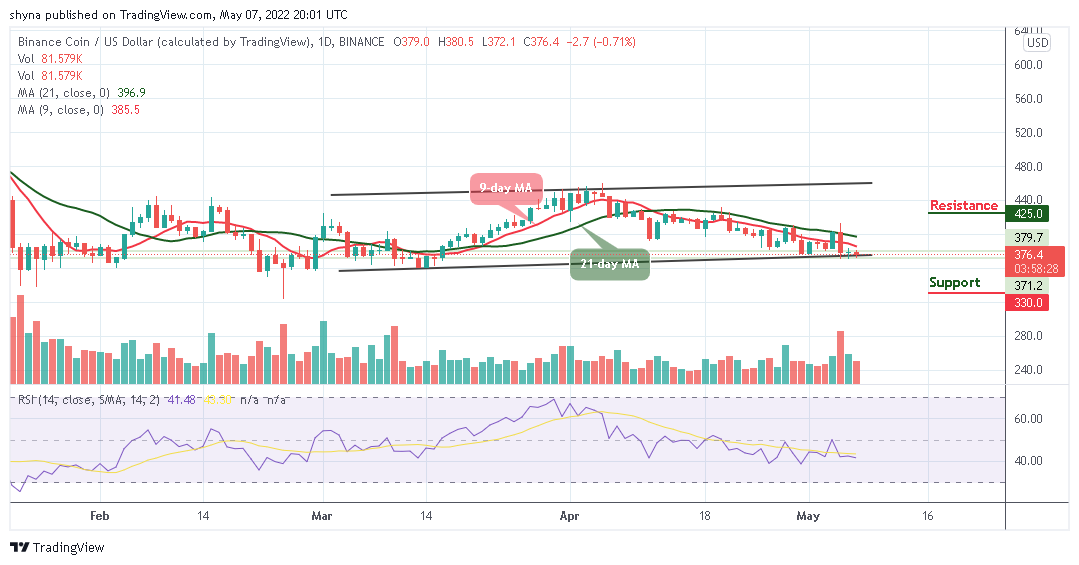
BNB/USD price may continue to drop until it finds support at the expected level of $350. The daily chart reveals that the Binance Coin is currently trading near the lower boundary of the channel. If the bears continue to push the market further lower, the immediate support level may be located. Crossing below the lower boundary of the channel may hit the supports at $330, $320, and $310.
Binance Coin Price Prediction: Binance Coin Downtrends May Continue
As the daily chart reveals, if the buyers can hold the support at $375 and the Binance Coin price begins to climb higher, the bulls may expect immediate resistance to be located at $400 which is further above the 9-day and 21-day moving averages. Above this level, higher resistance lies at $425, $435, and $445. The technical indicator Relative Strength Index (14) may soon cross below 40-level if the bears put more pressure, which could indicate that the market may continue the downward movement.
BNB/BTC Market: Price May Keep Moving Sideways
Against BTC, the BCH price is hovering above the 9-day and 21-day moving averages. However, if the price action crosses above the upper boundary of the channel, Binance Coin may begin the bullish movement. Therefore, the bulls need more strong and more consistent resistance to snatch the market price from the bear run.
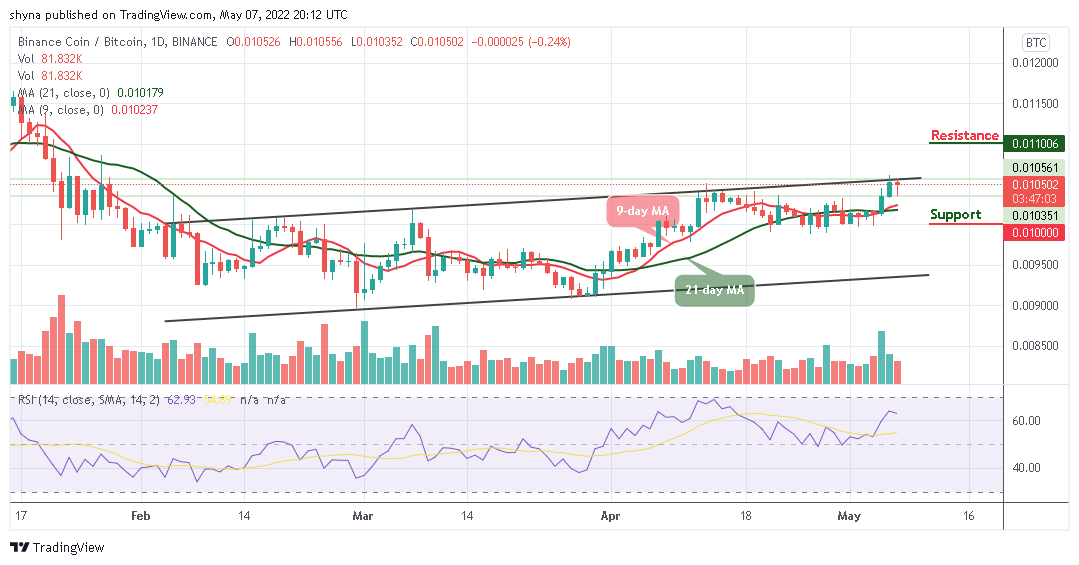
At the moment, with the current movement in the chart, if the price failed to break above the channel, it may slide below the moving averages to hit the critical supports at 0.010 BTC and below. In other words, if the market breaks above the upper boundary the, BNB/BTC could hit a resistance level of 0.011 BTC and above as the technical indicator Relative Strength Index (14) stays above the 60-level, suggesting bullish movement.
Read more:


