Bitcoin Price Prediction – January 22
There has been a further significant declining moving nature in the BTC/USD market operations as the crypto-economic business lowers, trading at a $37,500 psychological support line. Presently, price is around a lower value-line of around $36,738 at a minute positive percentage rate of about 0.51.
BTC/USD Market
Key Levels:
Resistance levels: $40,000, $42,500, $45,000
Support levels: $37,500, $35,000, $32,500
BTC/USD – Daily Chart
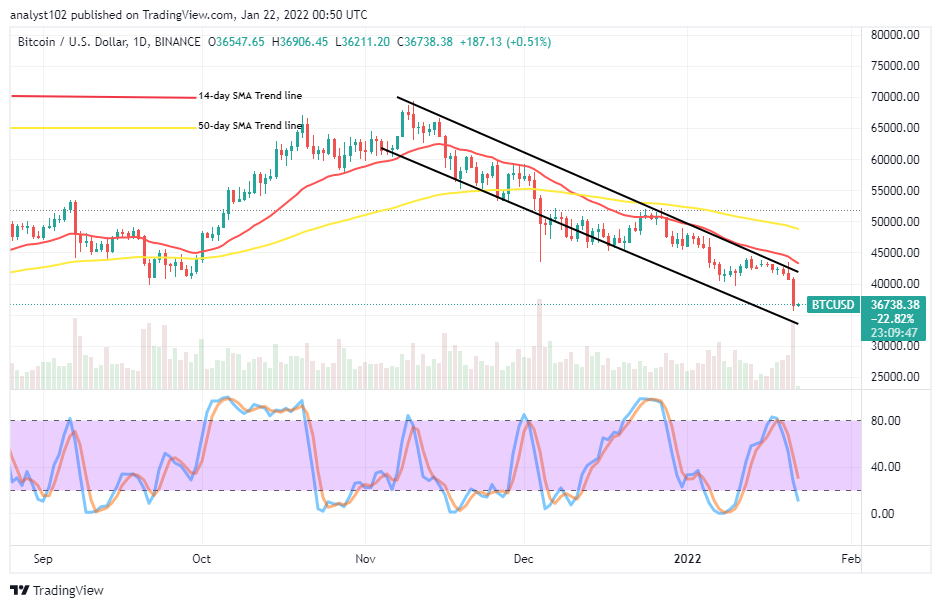
The BTC/USD daily chart shows that the crypto business economy lowers, trading at a $37,500 psychological level. In the recent past sessions, the price was trading between $40,000 and $45,000. Yesterday’s activities ended with the formation of a bearish candlestick that eventually plunged the business transactions into a more visible lower-trading zone, as depicted on the chart. The 14-day SMA indicator bends southward underneath the 50-day SMA indicator above variant candlesticks. The Stochastic Oscillators have briefly dipped into the oversold region, pointing toward the southbound within. The impact of the downward forces is on the crypto trading activities.
Will there be further sustainable downs as the BTC/USD business economy lowers, trading at $37,500?
There may be further sustainable downs in the BTC/USD business economy as the price lowers, trading at $37,500 psychological trading level zone if the current downing pressures get intensified in a slow-and-steady moving manner. Being as it is, the levels between $37,500 and $32,500 are likely to witness a round of trading supports building to allow some rallying motions to surface afterward.
On the downside of the technical analysis, the BTC/USD market position takers have to maintain their stances through the pace of selling wall created by a bearish candlestick that emerged during yesterday’s operations against the $40,000 level. A sudden fearful bounce-off of the crypto-economic price at the value line will put bears on their toes to be on the lookout for another round of movement rejections at a higher spot before taking re-launching order positions.
BTC/USD 4-hour Chart
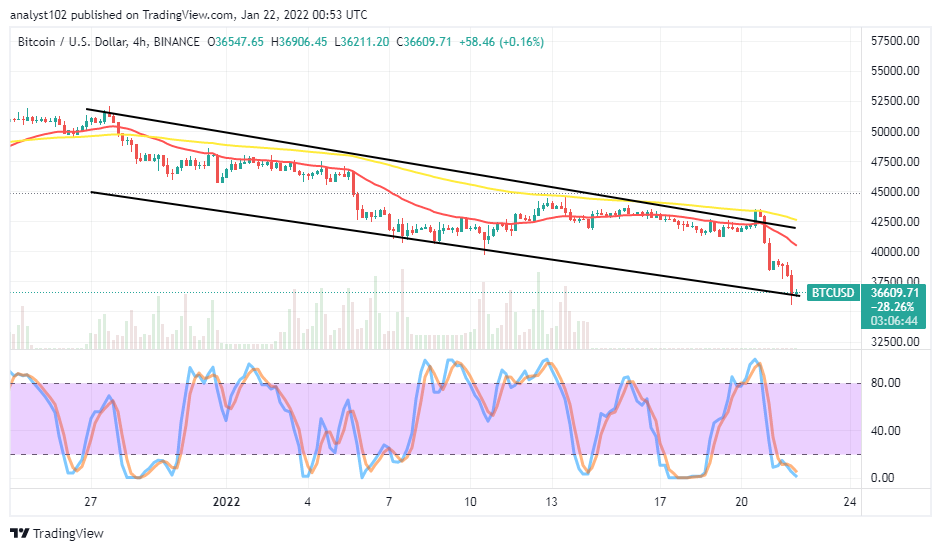
The BTC/USD 4-hour chart reveals the crypto business economy lowers, trading at $37,500. The market seems to find support between the value line and the lower level at $35,500 in the near time. The SMAs are a bit far above the current trading zone. The 50-day SMA trend line is above the 14-day SMA trend line. The lower bearish trend line currently experiences the possibility of being pushed to the downside as the price is struggling to accord with leftover depression at that level. The Stochastic Oscillators are in the oversold region with their lines conjoined, slightly pointing to the southbound closer to the range of zero. That signifies that the downward force is gradually relaxing in its capacity.
Looking to buy or trade Bitcoin (BTC) now? Invest at eToro!
68% of retail investor accounts lose money when trading CFDs with this provider.
Read more:


