Bitcoin Price Prediction – March 26
A line of northward pushes occurrence has surfaced in the BTC/USD trade operations over time. It observed that the crypto-economic market closely averages $45,000 resistance. The crypto keeps a minute negative percentage of 0.06 as it trades in the high and low of $44,650 and $44,135 value-lines.
BTC/USD Market
Key Levels:
Resistance levels: $45,000, $47,500, $50,000
Support levels: $42,500, $40,000, $37,500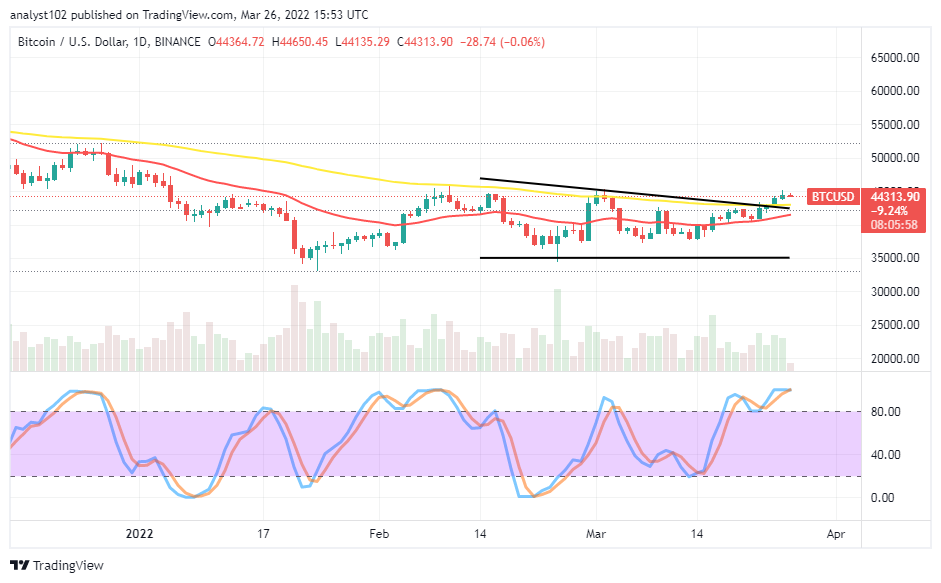 BTC/USD – Daily Chart
The BTC/USD daily chart showcases the crypto-economic market closely averages $45,000 resistance level. The movement has been forthcoming in a slow-and-steady manner. The 14-day SMA indicator slightly curved northward below the 50-day SMA indicator. Price has pushed above the bigger SMA trend line but not too far away. The Stochastic Oscillators are in the overbought region, moving in a consolidation style. It shows the US economy is having it uglier to counter the purchasing power of the base crypto.
Will the US Dollar lose more momentum to Bitcoin as the crypto-economic market closely averages a $45,000 resistance level?
The current pushing pace in the BTC/USD trade operations lacks volatility to detect timely definite direction. And that has made the situation not to be pre-determined as of the present as the market closely averages a $45,000 resistance level. All in all, long-position takers appear heading toward the losing sustainable stances in no time as there can be a correction.
On the downside of the technical analysis, the BTC/USD market short-position takers may nurture the habit ton the lookout for possible active price reversal motion before considering a sell order. A bearish engulfing candlestick is necessary to emerge against the 50-day SMA trend line to the downside to have a formidable sell wall that can obtain in the long run provided the $45,000 resistance doesn’t breach out for an upward rallying motion continuation.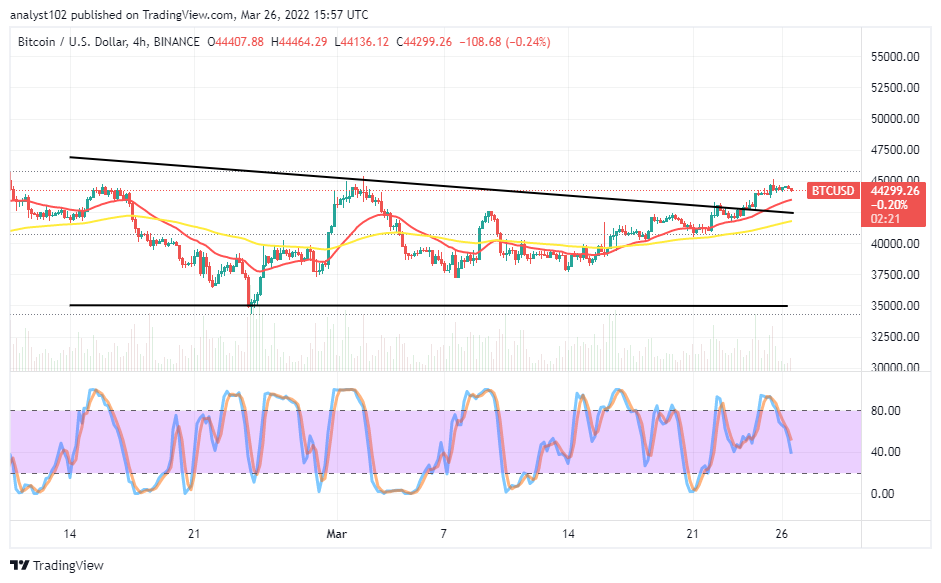
BTC/USD 4-hour Chart
The BTC/USD medium-term chart shows the crypto-economic market closely averages $45,000 resistance level. The 14-day SMA indicator has crossed the bearish trend line to the upside above the 50-day SMA indicator. The Stochastic Oscillators have crossed southbound from the overbought region to touch the range of 40. The smaller SMA trend line would have to breach southward sustainably to signal possible decent selling forces afterward.
Looking to buy or trade Bitcoin (BTC) now? Invest at eToro!
68% of retail investor accounts lose money when trading CFDs with this provider.
Read more:


