Bitcoin Cash price extended losses and traded below the $450 support. BCH is consolidating and might start a recovery wave if there is a move above $440.
- Bitcoin cash price started a fresh decline below the $440 support.
- The price is trading below $440 and the 100 simple moving average (4 hours).
- There is a key bearish trend line forming with resistance at $438 on the 4-hour chart of the BCH/USD pair (data feed from Kraken).
- The pair could start a decent upward move if it clears the $440 resistance zone.
Bitcoin Cash Price Revisits Support
In the past few days, there has been a steady decline in Bitcoin Cash price like Bitcoin and Ethereum. BCH declined below the $450 and $440 support levels to move into a short-term bearish zone.
A low was formed at $421 and the price is now consolidating losses. There was a minor move above the $430 level. The price climbed above the 23.6% Fib retracement level of the downward move from the $457 swing high to the $421 low.
Bitcoin cash price is still trading below $440 and the 100 simple moving average (4 hours). Immediate resistance on the upside sits near the $438 level. There is also a key bearish trend line forming with resistance at $438 on the 4-hour chart of the BCH/USD pair.
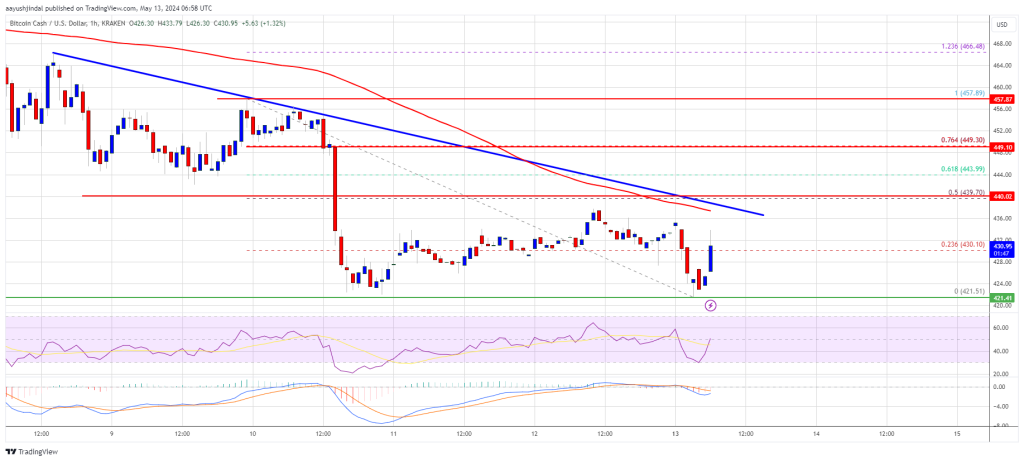
Source: BCH/USD on TradingView.com
The trend line is close to the 50% Fib retracement level of the downward move from the $457 swing high to the $421 low. A clear move above the $440 resistance might start a decent increase. The next major resistance is near $4502, above which the price might accelerate higher toward the $465 level. Any further gains could lead the price toward the $480 resistance zone.
Fresh Drop in BCH?
If Bitcoin Cash price fails to clear the $438 resistance, it could start a fresh decline. Initial support on the downside is near the $425 level.
The next major support is near the $420 level, where the bulls are likely to appear. If the price fails to stay above the $420 support, the price could test the $400 support. Any further losses could lead the price toward the $384 zone in the near term.
Technical indicators
4-hour MACD – The MACD for BCH/USD is losing pace in the bearish zone.
4-hour RSI (Relative Strength Index) – The RSI is currently in near the 50 level.
Key Support Levels – $425 and $420.
Key Resistance Levels – $440 and $450.


