Market Experiences Falling Pressures – January 24
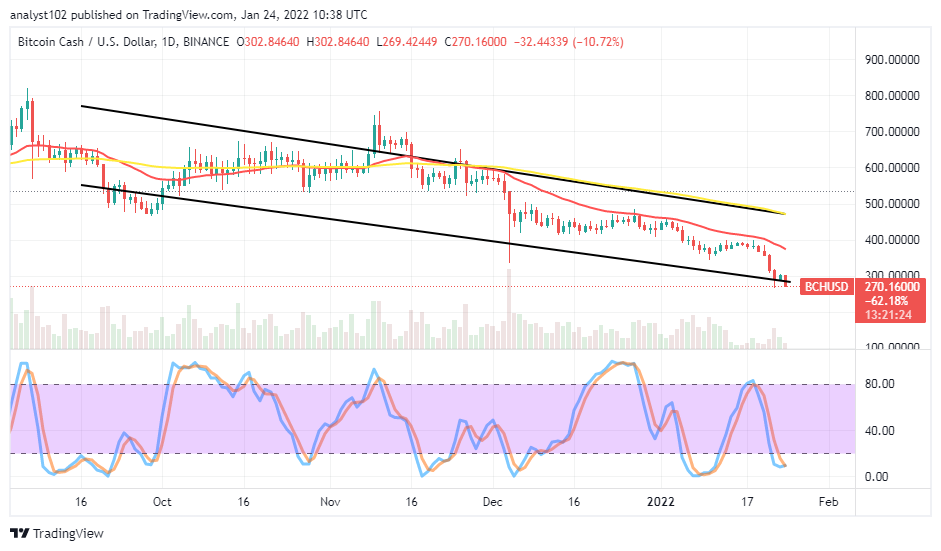
There has been a continual bearish-moving nature in the BCH/USD trade operations as the crypto market experiences falling pressures on a higher mote. The crypto-economic balance sheet shows an opening valuation of around $302 as the price now lowers to trade around $269 at a percentage rate figure of about 1.72 negatives.
Market Experiences Falling Pressures: BCH Market
Key Levels:
Resistance levels: $350, $400, $450
Support levels: $250, $200, $150

BCH/USD – Daily Chart
The BCH/USD daily chart showcases the crypto-economic market experiences falling pressures as there has been a formation of smaller bearish candlesticks around the lower bearish channel trend line. That denotes the possibility of the trade succumbing further to depressions. The upper bearish channel trend line drew alongside the 50-day SMA indicator above the 14-day SMA indicator. The Stochastic Oscillators are in the oversold region, suggesting the possibility of seeing the price attempting to regain partially parts of its lost momentums to the US Dollar.
Will there be a steady-continual declining motion beneath the $300 as the BCH/USD market experiences falling pressures?
For a while, there may be featuring of lower highs and lower lows around the $300 trading level as the BCH/USD market experiences falling pressures. In the course of that assumption materializing, staging of buying orders at that trading spot may still suffer a setback as it is, that the bearish-trading cycle has to be against giving in ways to upward swings in the long run.
On the downside of the technical analysis, the BCH/USD market short-position takers may still have to get reshaped along the trend line of the 14-day SMA to get decent entry to the downside. Following the market’s downward trend presently at $300 may not be perfectly safe for a long time. Traders needed to allow some degrees of pull-ups, giving back to a sudden falling force before subscribing to sell positions.

BCH/BTC Price Analysis
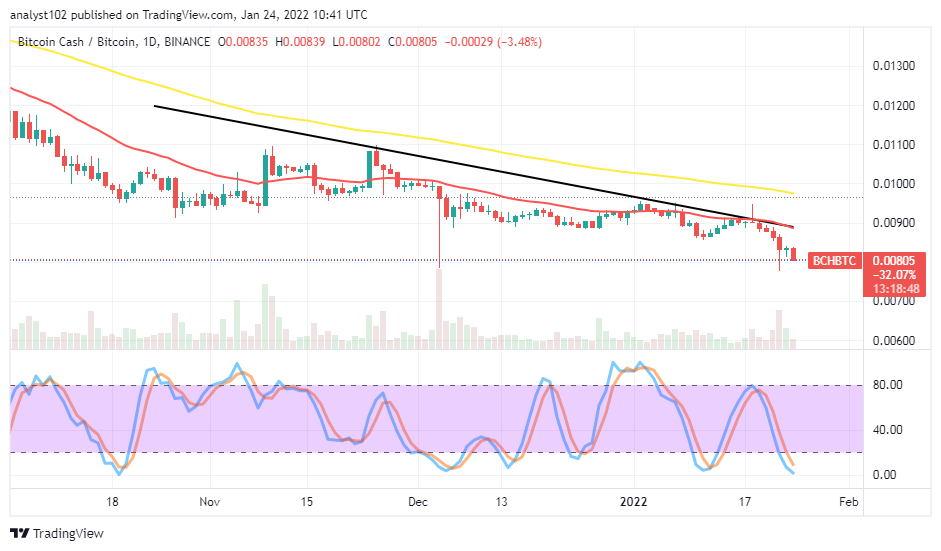
In comparison, Bitcoin Cash still trends in a southward-direction outlook, as placed with Bitcoin. The cryptocurrency pair market experiences falling pressures in a continual moving pattern. The 50-day SMA indicator is above the 14-day SMA indicator. The Stochastic Oscillators have dipped into the oversold region, slightly pointing to the south side to indicate that the depressive motion isn’t yet complete. The base crypto may still lose more stances to the most valuable counter crypto in the subsequent operations.
Looking to buy or trade Bitcoin (BTC) now? Invest at eToro!
68% of retail investor accounts lose money when trading CFDs with this provider.
Read more:


