Market Intensifies Efforts at Rebounding – March 22
It has been a long time the BCH/USD trade activities hover around $300. The situation was not easy to get a definite change of price direction. Presently, the crypto-economic market intensifies efforts, staging a rebound closely toward the $400 retarding line as it trades between $365 and $334 value-lines at a positive percentage of 8.22.
Trade Attempts Downsizing: BCH Market
Key Levels:
Resistance levels: $400, $450, $500
Support levels: $350, $300, $250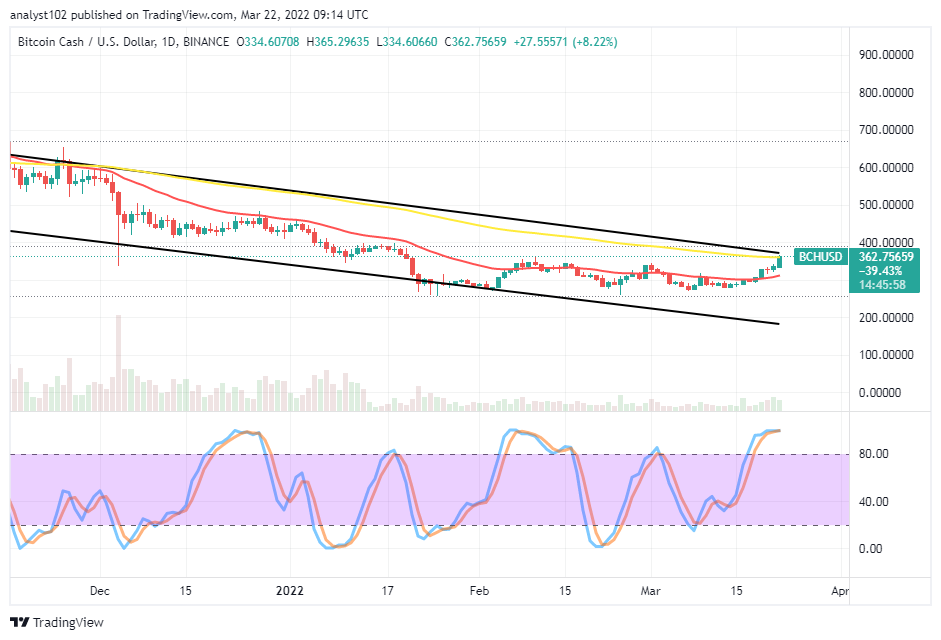 BCH/USD – Daily Chart
The BCH/USD daily chart showcases the crypto-economic market intensifies efforts, The 14-day SMA indicator is underneath the 50-day SMA indicator. A bullish candlestick is in the making, possibly to touch a specific resistance zone before exhaustion. The Stochastic Oscillators are in the overbought region. And they have conjoined, seemingly pointing toward the northbound within. That indicates the upward force isn’t over in a hurry.
Will the BCH/USD trade keep the upward forces as the market intensifies efforts at rebounding?
It might not technically sound well that the BCH/USD trade keeps the upward forces sustainably for a long-term running course as the market intensifies efforts at rebounding from a lower range level. Price is now touching the trend line of the 50-day SMA since around early last December 2021 while continually downing around the 14-day SMA trend line below the point of $600. Buyers may tend to lose momentum at a slight breakout of $400.
On the downside of the technical analysis, the BCH/USD market sellers have to be on the lookout for a weakness in the current upward pressures as the price is rebounding toward the $400 resistance before considering a shorting order. Some smaller bearish candlesticks may need to emerge at a higher resistance point around the value-line to signal a safer launch of a sell position afterward.
BCH/BTC Price Analysis
In comparison, Bitcoin Cash has been pushing against Bitcoin as it is on the daily price analysis chart. There has been a straight-line bullish candlesticks formation against the trend line of the bigger SMA. The 14-day SMA indicator is underneath the 50-day SMA indicator. The Stochastic Oscillators are in the overbought region, attempting to close their lines. If the attempted closure of the lines leads to conjoining, it will mean the base crypto will be taking its time to either push upward more or run into a pause for a while. On the contrary, a successful closing and eventual crossing to the southbound will signify the base crypto stands to have reached the peak point that it can push for the time being against the flagship countering crypto.
Looking to buy or trade Bitcoin (BTC) now? Invest at eToro!
68% of retail investor accounts lose money when trading CFDs with this provider.
Read more:


