A crypto analyst has revealed that the recent pullback in the Bitcoin (BTC) price has triggered a Fischer Transform indicator reminiscent of the 2022 bear market. Despite its poor performance over the past weeks, the analyst further predicts that BTC could see maximum pain ahead, indicating a significant downturn that could continue for the next four months.
Bitcoin Fischer Transform Signal Past Bear Market Levels
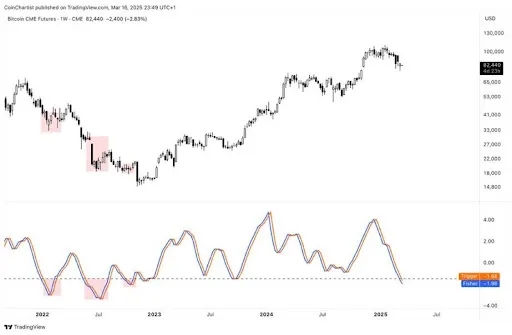
X (formerly Twitter) crypto analyst Tony Severino has shared a technical analysis highlighting a weekly Bitcoin Chicago Mercantile Exchange (CME) chart with the Fischer Transform indicator plotted below. The analyst highlights that this BTC CME indicator has reached levels not seen since the 2022 bear market, suggesting a potentially overextended downside move.
The Fischer Transform is a momentum oscillator designed to highlight turning points in price. It is used to indicate when prices have moved to an extreme based on recent price action. In the case of Bitcoin, Severino reveals that its Fischer Transform indicator has dropped to -1.96, with the corresponding trigger line at -1.66—all significantly low readings.
Historically, similar readings have been observed during significant market downturns, including the famous bear market in 2022, which saw the Bitcoin price fall from all-time highs to drastic lows. The last time the Fischer Transform flashed such lows, BTC was in a prolonged sell-off, experiencing intense volatility and eventually bottoming out before staging a price recovery.
Given this precedent, Severino now closely watches to determine whether Bitcoin will completely repeat historical trends and record a similar bear market decline. Currently, the price is trading at $83,285, falling more than 20% from its all-time high of over $104,00 this year.
BTC Price Set For Maximum Pain
In a more recent X post, Severino predicts that Bitcoin is set for maximum pain in this bull cycle. The analyst shared a Bitcoin CME weekly chart with Bollinger Bands and Bollinger Band Width indicator at 32.2, suggesting a period of consolidation and further breakdown.
The Bitcoin price recently expanded outside the Bollinger Bands, indicating a period of high volatility. The analyst’s chart shows Bitcoin’s basis Bollinger Band price at $94,917, acting as a resistance area before further upside movements.
Severino’s analysis suggests that Bitcoin may remain range-bound for 90 – 120 days before attempting another breakout. He revealed that the pioneer cryptocurrency is expected to spend this prolonged time frame in a deadlock disagreement between bulls and bears.
Looking at the Bollinger Band chart, the analyst highlights a possible decline to the lower Bollinger Band price of $79,633. If the basis price of $94,917 is exceeded, BTC is expected to hit a new ATH around the upper Bollinger Band price of $110,201. This would represent a price increase of over 30% from its current market value.


