Bitcoin is trading below key resistance levels as bulls continue to struggle to ignite a recovery rally. Since peaking in January, BTC has been trapped in a persistent downtrend, losing over 29% from its all-time high. This sustained weakness has sparked growing concerns among investors and analysts, with some warning that a bear market may be underway.
Despite the cautious sentiment, there is still hope among market watchers who believe Bitcoin is undergoing a healthy correction within a broader bull cycle. They argue that the recent dip could present a long-term buying opportunity, especially if key support levels hold and bullish signals emerge in the coming days.
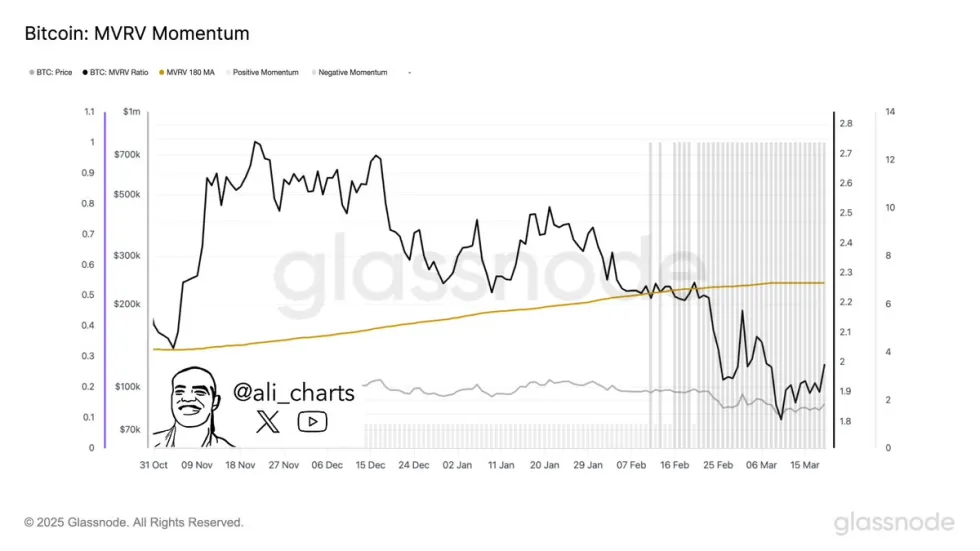
One such signal may come from the MVRV momentum indicator and the 180-day simple moving average (SMA). According to data from Glassnode, the two metrics are approaching a potential golden cross—an event historically associated with major upward moves in Bitcoin’s price. If this crossover is confirmed, it could mark a shift in market momentum and signal that BTC is preparing for another leg up in its current cycle.
Bitcoin Inches Higher As Analysts Watch For Bullish Signal
Bitcoin is trading above crucial demand levels after a sharp recovery from Tuesday’s $81,000 low. The world’s largest cryptocurrency has bounced over 7% since then, providing a glimmer of hope for bulls after weeks of relentless selling pressure and macro-driven uncertainty. Since its all-time high near $109,000 in January, Bitcoin has lost more than 29% of its value, triggering debates among analysts about whether the market is still in a bull cycle or at the start of a new bearish phase.
Despite the doubts, key technical indicators may suggest a shift in sentiment. According to top analyst Ali Martinez, the MVRV momentum indicator and the 180-day simple moving average (SMA) are approaching a golden cross—a historically bullish signal that often precedes strong upward trends. This crossover, if confirmed, would mark a potential inflection point and reinforce the idea that the recent correction may be part of a broader bull run rather than a complete trend reversal.
Still, Bitcoin has work to do. Bulls must hold current levels and push above the $88K–$90K zone to confirm a recovery and retest the previous highs. For now, traders are cautiously optimistic, watching on-chain metrics and technical indicators closely for the next big move.
BTC Price Struggles Below Key Averages Amid Uncertainty
Bitcoin is currently trading at $83,900, continuing to hover below critical resistance as bulls attempt to reclaim momentum. The price has been trapped below the 200-day simple moving average (SMA) and the 200-day exponential moving average (EMA), which now act as key technical barriers near the $85,500–$86,000 range. Reclaiming this level is essential for confirming a recovery rally, especially after Bitcoin’s extended downtrend since late January.

Despite a 7% bounce from the recent low at $81,000, the market remains cautious. A decisive move above $86,000 would give bulls the strength needed to retest higher levels toward $90K and break the current bearish structure. However, without a strong push above this threshold, Bitcoin risks losing its short-term momentum and slipping back toward lower demand zones.
If the $86K mark continues to reject price action, a move below $81K could follow, potentially triggering more selling pressure and panic among retail investors. The coming days will be critical, as bulls must show strength and defend current levels to avoid further downside. Market participants are closely monitoring both technical indicators and macroeconomic developments for clues on Bitcoin’s next direction.
Featured image from Dall-E, chart from TradingView


