Bitcoin has seen a crash to the $87,000 level in the past day, but if on-chain data is to go by, the plunge could get much deeper.
Bitcoin Has Lost An Important Support Level With The Crash
In a new post on X, the on-chain analytics firm Glassnode has discussed about how some Bitcoin indicators have changed following the plunge in the cryptocurrency’s price.
The first metric that the analytics firm has shared is the Realized Price of the short-term holders. The “Realized Price” keeps track of the cost basis of the average investor or address on the BTC network.
When the spot price of the asset is trading above this indicator, it means the investors as a whole can be considered in a state of profit. On the other hand, it being under the metric implies the dominance of loss in the market.
In the context of the current topic, the Realized Price of only a segment of the userbase is of interest: the short-term holders (STHs), who refer to the investors who purchased their coins within the past 155 days.
Now, here is a chart that shows the trend in the Bitcoin STH Realized Price over the last few months:
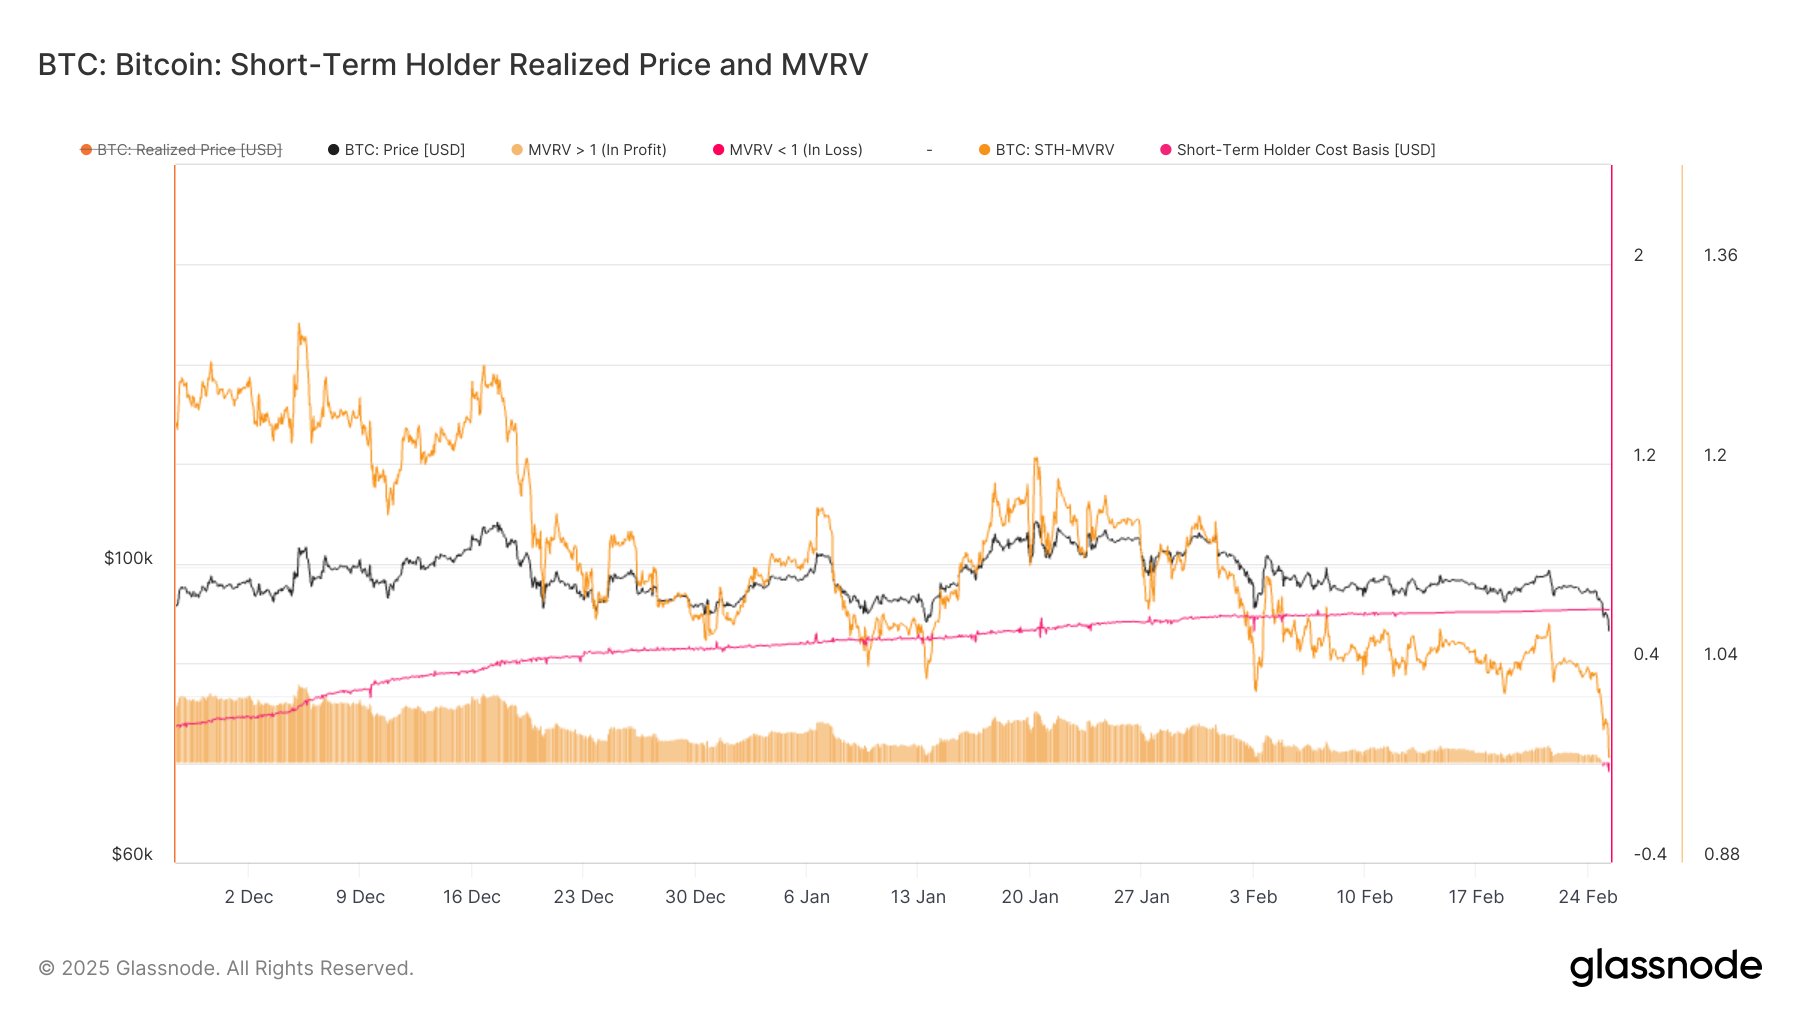
As displayed in the above graph, Bitcoin was trading above the STH Realized Price during the last few months, meaning the STHs were enjoying profits, but with the latest crash, the situation has flipped.
The STH Realized Price is equal to $92,500, so at the current spot price, the members of this cohort would be carrying an average loss of more than 6%. “A failure to reclaim STH cost basis could mean continued sell pressure from recent buyers,” notes Glassnode.
As for how far BTC could fall from here, perhaps historical pattern could hold a hint. According to the analytics firm, the post-ATH corrections of May 2021, November 2021, and April 2024 all saw BTC fall one standard deviation below the STH Realized Price.
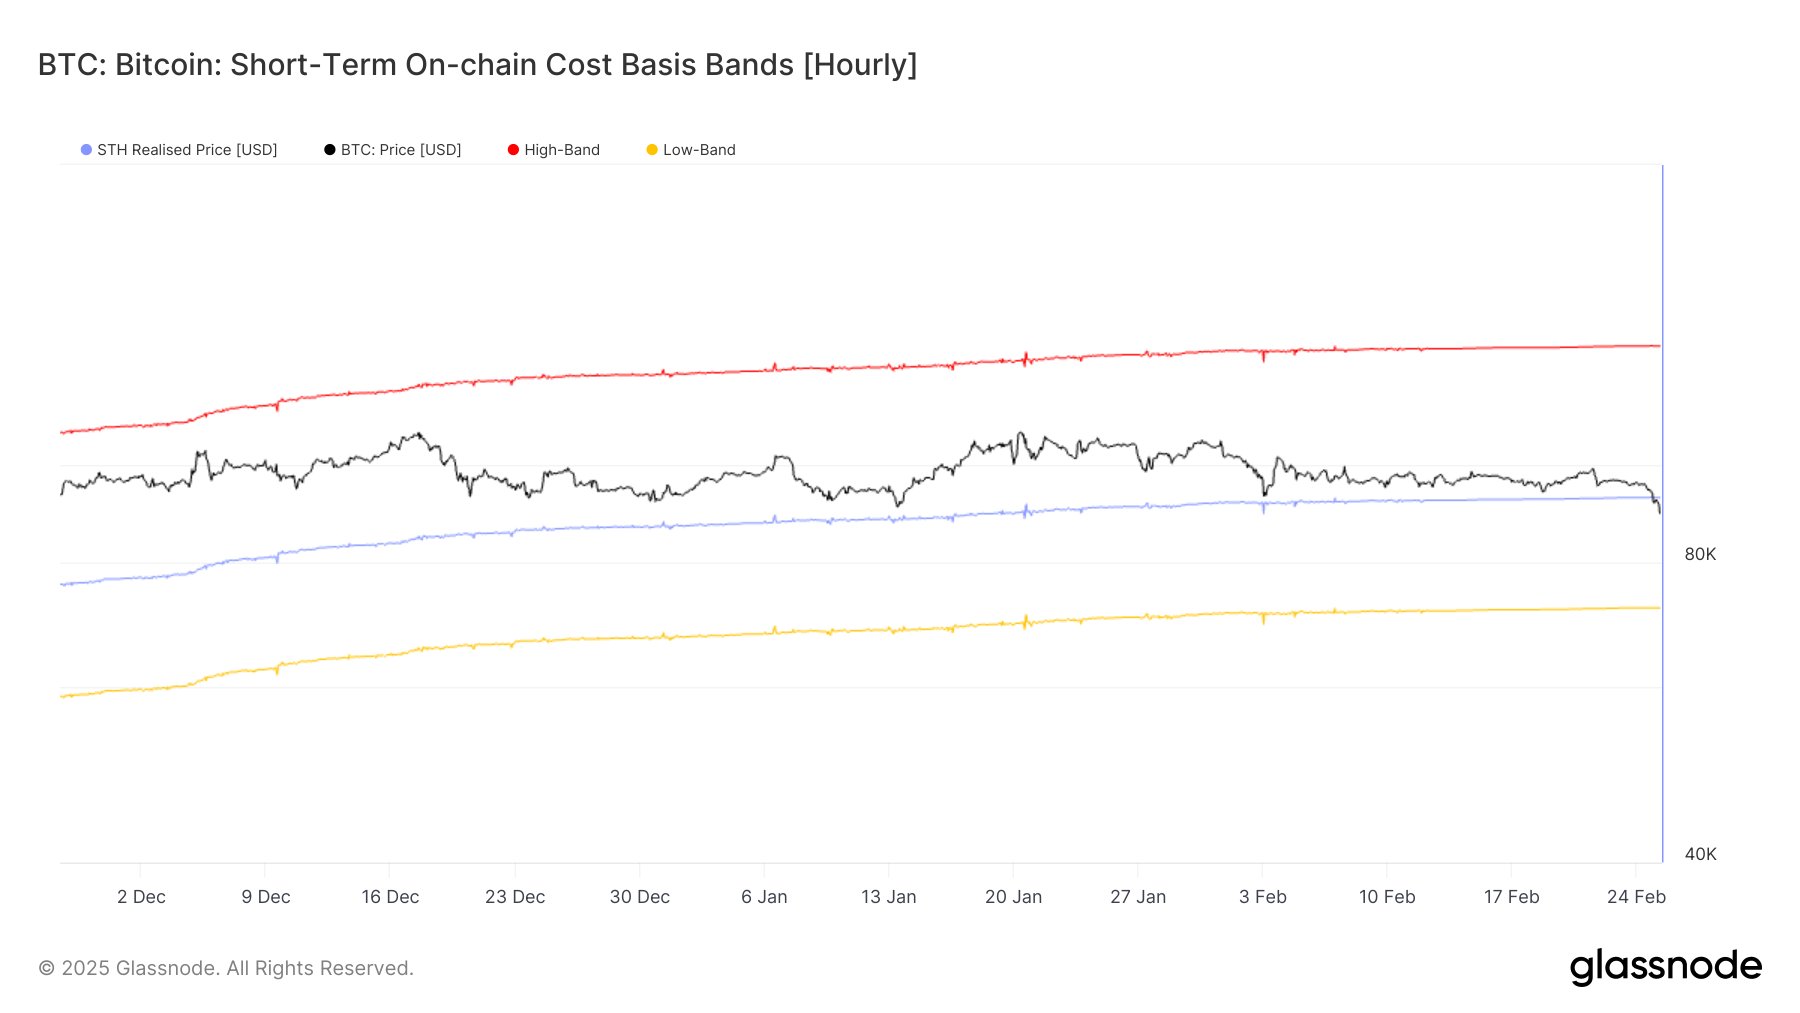
At present, this price band is situated between $71,000 and $72,000. If the past pattern is to go by, it’s possible that this correction may also lead Bitcoin to near this band.
The Cost Basis Distribution, another metric related to investor cost basis, also highlights this same level as being important for the cryptocurrency.
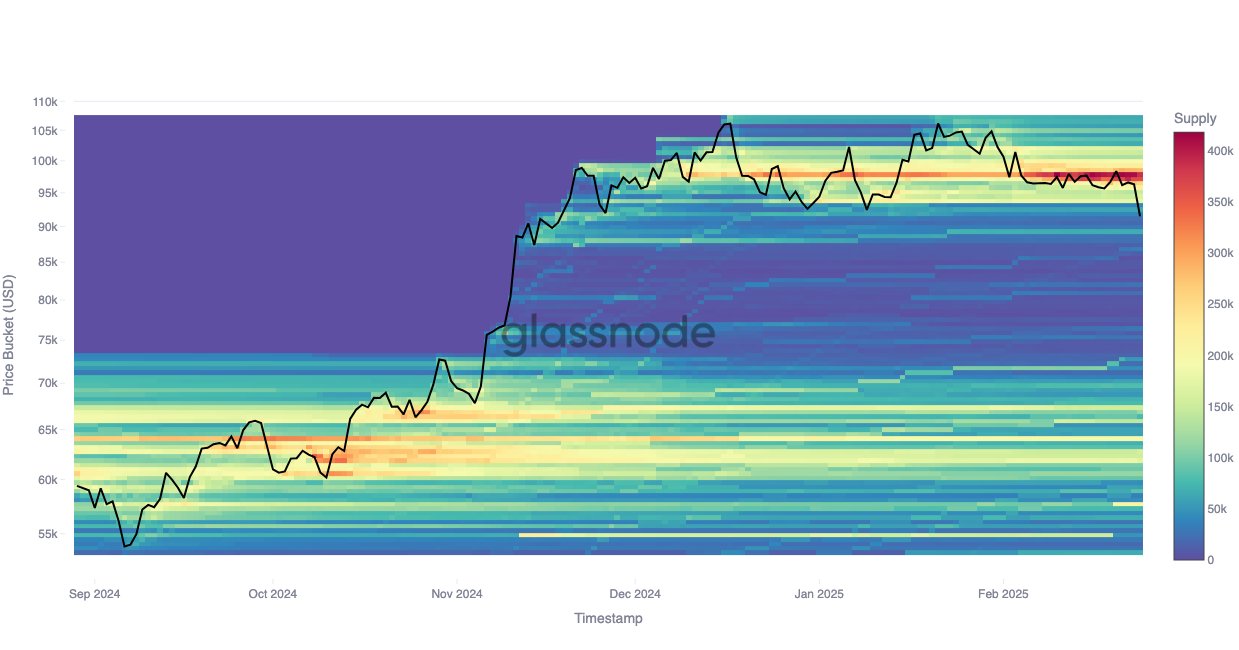
From the chart, it’s apparent that a substantial amount of investors have their cost basis at various zones above $87,000. Under this mark, however, very few addresses bought their coins, until the same $71,000 to $72,000 band. “This could mean weaker support in this range, giving bears more control,” explains the analytics firm.
BTC Price
At the time of writing, Bitcoin is floating around $87,200, down more than 7% over the last week.


