Bitcoin is trading below crucial support levels after massive selling pressure swept through the market. Since late January, BTC has lost over 29% of its value, fueling fear and uncertainty among investors. With global trade war fears intensifying and volatile macroeconomic conditions shaking the crypto and U.S. stock markets, traders are bracing for further downside risk.
Market sentiment remains overwhelmingly bearish as Bitcoin fails to hold key technical levels. Crypto analyst Daan shared a technical analysis on X, revealing that BTC has broken below the Daily 200-Moving Average (MA) and has now retested it as resistance. Historically, this pattern signals a continuation of bearish price action, indicating that BTC could see more downside in the coming weeks.
With Bitcoin struggling to regain momentum, the market’s next major move will depend on whether bulls can reclaim lost ground or if further selling pressure will drive BTC toward lower support levels. As uncertainty grows, investors remain cautious, waiting for clear signals before making significant moves. The coming days will be crucial in determining whether Bitcoin can stabilize or if the current downtrend will continue.
Bitcoin Downtrend Deepens as Bears Maintain Control
Bitcoin has remained in a persistent downtrend since late January, with fear continuing to set lower price targets among investors. Many now question whether the BTC bull cycle is over, as selling pressure intensifies and market sentiment turns increasingly bearish.
The uncertainty surrounding macroeconomic conditions has fueled this decline, with volatility increasing since the U.S. elections in November 2024. Given the ongoing trade war fears and unstable global markets, it appears that this period of uncertainty will continue to weigh on Bitcoin’s price action.
Crypto analyst Daan recently shared technical insights on X, highlighting that BTC has lost the 200-day moving average (MA) and has now retested it as resistance. This signals that bears remain in control, and bulls have a lot of work to do to reclaim this level.
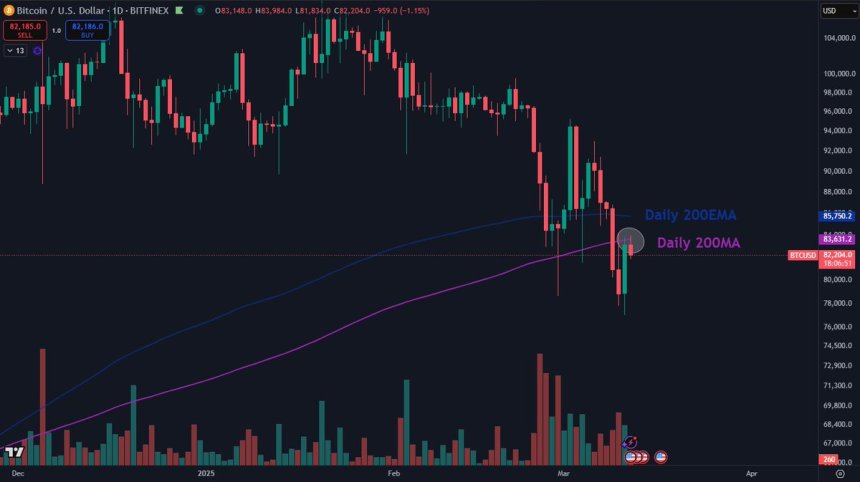
According to Daan, Bitcoin experienced a similar scenario last year, where price action chopped around these levels for over three months before breaking out. If history repeats itself, BTC could be entering another extended consolidation phase, keeping prices range-bound for months.
However, if bulls fail to reclaim the 200-day MA/EMA, further downside could follow, bringing Bitcoin to even lower price levels. With bears still in control, the market remains highly fragile, and investors are watching closely to see whether BTC can stabilize or if another major drop is on the horizon. The next few weeks will be critical as Bitcoin either finds a foothold or continues deeper into bearish territory.
Bitcoin Stuck Between $80K and $85K as Fear Continues
Bitcoin (BTC) is currently trading between $80,000 and $85,000, struggling to reclaim key price levels amid growing panic selling and fear. With selling pressure dominating the market, investors remain uncertain about Bitcoin’s next move as bulls fail to push BTC into a recovery phase.

For a bullish reversal, BTC must hold above $80,000 and reclaim the $86,000 level, which would signal renewed buying interest and possibly set the stage for a stronger uptrend. However, Bitcoin may enter a sideways consolidation phase below $90,000–$88,000, prolonging the uncertainty and keeping price action choppy for weeks.
If BTC fails to defend the $80K level, the risk of a deeper correction increases, potentially pushing prices below critical support zones. A breakdown below $80K could trigger another wave of selling, sending BTC toward lower demand levels and extending the current bearish market structure. Traders remain cautious, closely watching whether Bitcoin can stabilize or if another major decline is ahead.
Featured image from Dall-E, chart from TradingView


