On-chain data shows the largest of Bitcoin investors have continued to buy recently. Here’s whether the other cohorts have followed in the footsteps of these titans or not.
Mid-Sized Bitcoin Holders May Finally Be Showing A Shift
In a new post on X, the on-chain analytics firm Glassnode has discussed about the how the Accumulation Trend Score has looked for the various cohorts in the Bitcoin market.
The “Accumulation Trend Score” is an indicator that tells us about whether the Bitcoin investors are participating in buying or selling. The metric checks not only the balance changes happening in the wallets of the holders, but also the size of the holdings themselves. This means that the indicator puts a higher weightage on the changes taking place that involve the large investors.
When the metric has a value greater than 0.5, it means the large addresses (or a large number of small entities) are participating in accumulation. The closer the metric gets to the 1 mark, the stronger this behavior becomes.
On the other hand, the indictor being under 0.5 implies the holders are taking part in distribution, or simply not doing any accumulation. Here, the extreme point lies at the 0 level.
In the context of the current topic, the Accumulation Trend Score of the entire sector isn’t of interest, but rather that of each investor cohort separately. There are different ways to classify holders, but the relevant one here is on the basis of wallet size.
Below is the chart for the indicator shared by the analytics firm that shows how the behavior has changed for the Bitcoin holder groups over the past year.
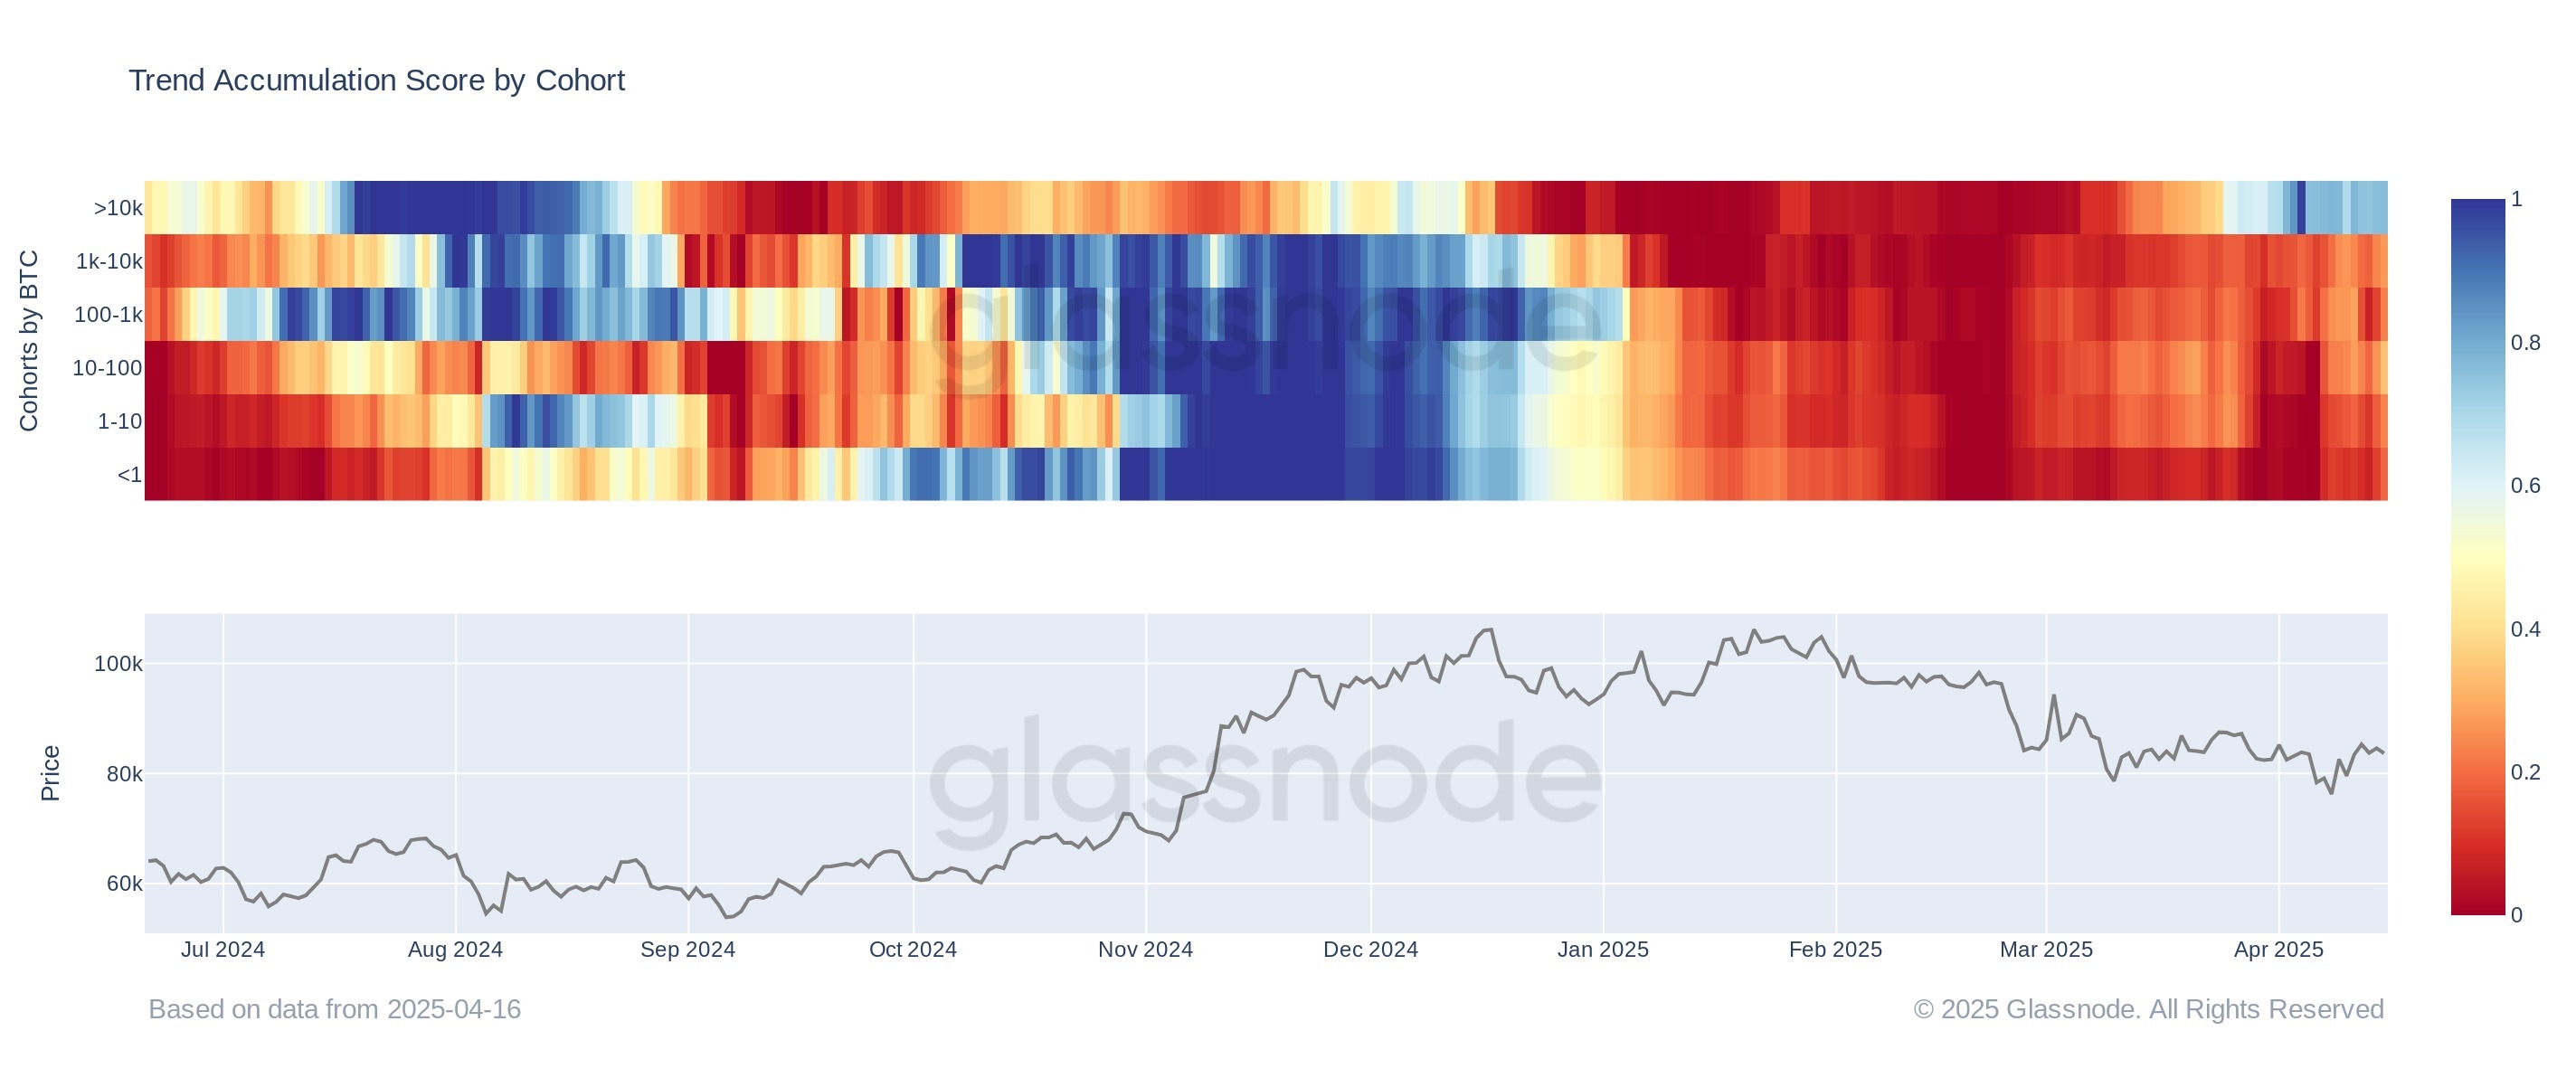
As is visible in the above graph, the Bitcoin Accumulation Trend Score took a bright red shade for all cohorts back in February, indicating market-wide strong distribution.
Since this selloff, the indicator’s value has gone up for the various cohorts, implying a cooldown of selling pressure has occurred. This cooldown has varied across the groups, however, with one cohort in particular diverging far away from the rest: the 10,000+ BTC holders.
Popularly, the investors carrying between 1,000 to 10,000 BTC are known a the whales, so these holders, who are even more humongous, could be termed the “mega whales.”
From the chart, it’s apparent that this group took to buying in March and has since seen its accumulation deepen as the Bitcoin Accumulation Trend Score has reached a value of around 0.7.
The rest of the market has also been easing up its distribution in this period, but none of them have moved into the accumulation territory yet. That said, the 10 to 100 BTC investors are close, with the score now sitting at 0.5 for them. “This suggests at a possible shift in sentiment from mid-sized holders,” notes Glassnode.
It now remains to be seen whether the trend of increase in the indicator would continue in the coming days and the rest of the Bitcoin cohorts would catch up with the mega whales or not.
BTC Price
Bitcoin has taken to sideways movement recently as its price is still trading around $84,500.


