On-chain data shows that Bitcoin is forming a pattern in its Total Amount of Holders, which last proved bullish for the cryptocurrency.
Bitcoin Has Seen A Fall In Its Total Number of Holders Recently
According to data from the on-chain analytics firm Santiment, BTC investors have been liquidating their wallets amid the recent bearish wave in the asset. The indicator of relevance here is the “Total Amount of Holders,” which measures, as its name suggests, the total number of addresses holding some balance on the network.
When the value of this metric goes up, it means new investors are joining the network, and old ones who had sold earlier are returning. The trend can also arise due to existing users creating new addresses for privacy purposes.
In general, some net adoption occurs when the Total Amount of Holders rises. Adoption is a constructive sign for any cryptocurrency in the long term.
On the other hand, the indicator registering a drop implies some investors have decided to exit from the asset as they are completely emptying their wallets.
Now, here is a chart that shows the trend in the Total Amount of Holders for five top coins in the sector: Bitcoin (BTC), Ethereum (ETH), XRP (XRP), Cardano (ADA), and Chainlink (LINK), since the start of the year:
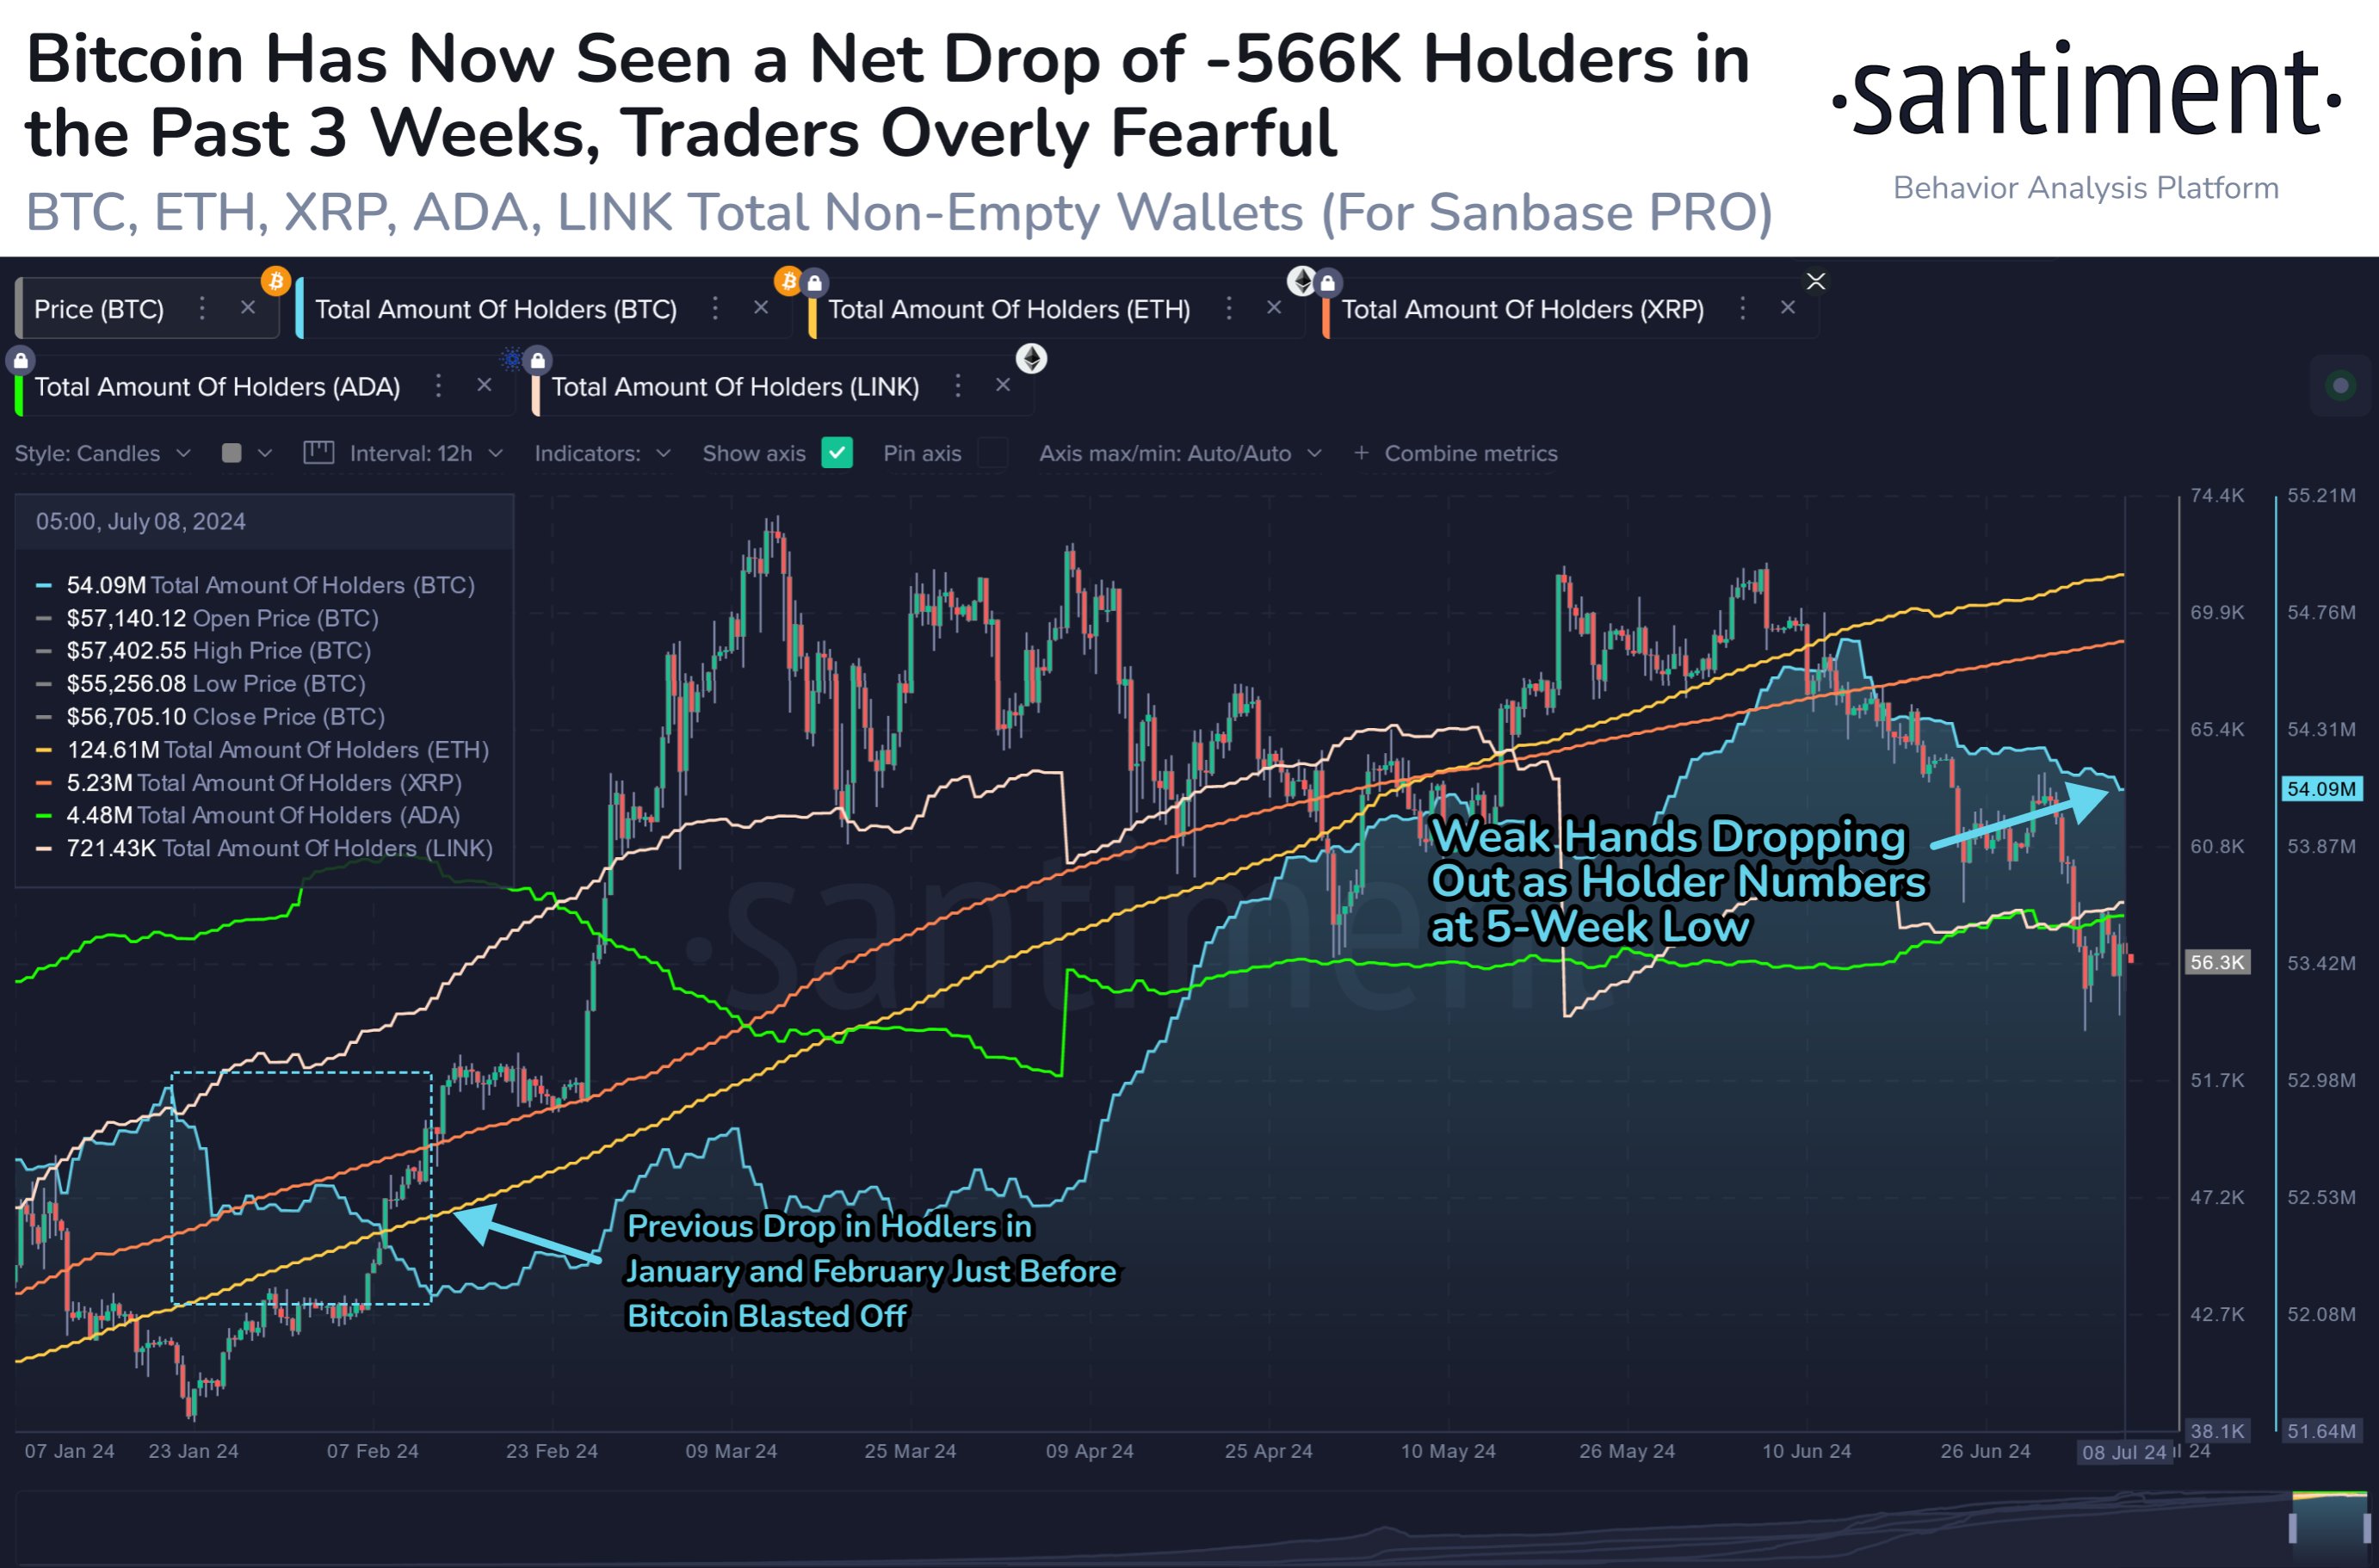
As is visible in the above graph, the total number of holders has recently gone through a drawdown for Bitcoin. This decline in the metric has come as the price of the asset itself has been moving down.
In total, 566,000 BTC wallets have emptied themselves during the last three weeks. The timing would suggest that the bearish market has spooked these investors into exiting.
Interestingly, Ethereum, Cardano, and XRP have continued to see a net increase in this indicator, implying that adoption has only furthered for these altcoins.
While BTC’s decrease does imply that holders are moving away from the network, the fact that FUD is the reason behind this departure may play into the cryptocurrency’s favor.
Historically, Bitcoin has tended to show moves in the direction opposite to what the crowd thinks, so the development of FUD has often led to the coin finding a reversal towards the upside.
From the chart, it’s apparent that the total amount of holders also decreased in January and February, and this trend followed a sharp rally for the coin towards a new all-time high (ATH).
“Patient bulls should be pleased with this, as self-liquidating wallets from impatient non-believers is a sign of FUD-causing bottoms, just like we saw in January,” notes Santiment.
BTC Price
At the time of writing, Bitcoin is trading at around $57,400, down more than 7% over the last week.


