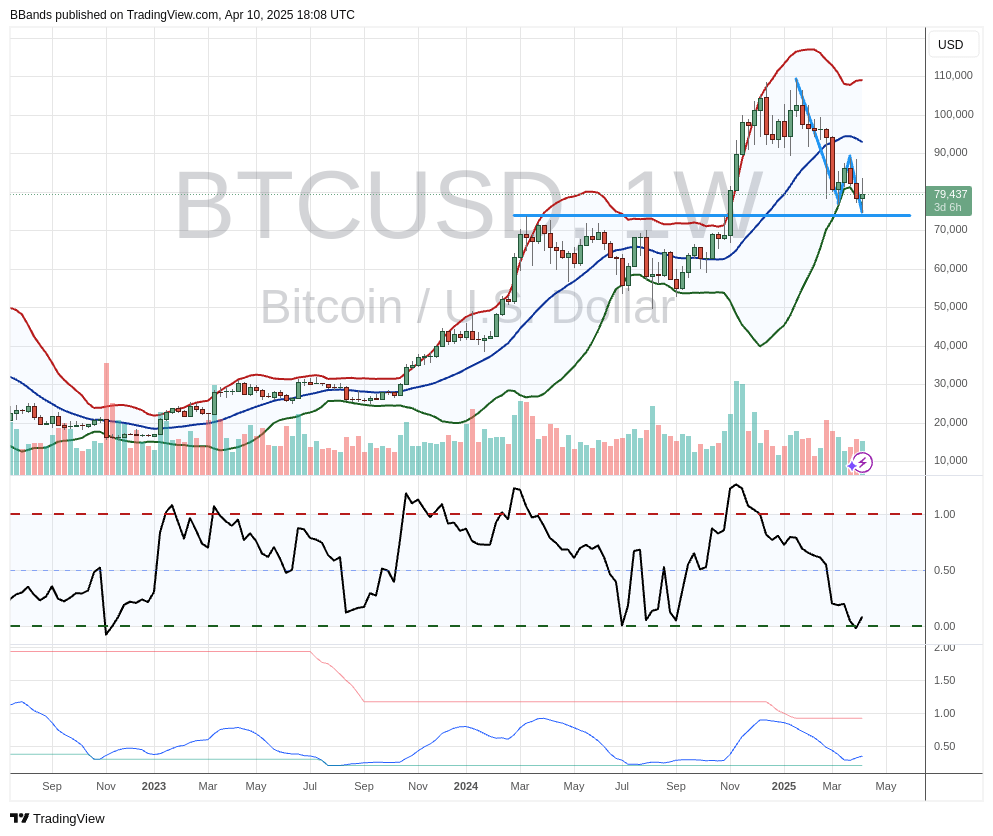
Legendary technical analyst John Bollinger has highlighted what he calls a “classic Bollinger Band W bottom” that may be forming on the Bitcoin pair BTC/USD. According to him, BTC appears to have found support in the $74,000 area, setting up the characteristic double-dip lows that define a W-shaped reversal pattern. Notably, Bollinger stressed that the setup still needs to be confirmed: “Classic Bollinger Band W bottom setup in BTCUSD. Still needs confirmation”.
Is The Bitcoin Bottom In?
The chart shows Bitcoin navigating a decline from its mid-January high near $110,000, with recent price action clustered around the lower band of the Bollinger Bands. The upper band sits at $108,837, while the lower band sits at $77,138, suggesting a relatively wide range of volatility on a weekly basis. The Bollinger’s mid-line is close to $93,000.
Bollinger’s indication of a W-bottom is based on the formation of two distinct troughs in quick succession, as seen in both the price data and the oscillator readings below the chart. The first trough materialised as BTCUSD fell from its then high of around $90,000 to the mid-$76,000 area, then rallied before sliding back to a comparable support area around $74,500. The repeated dip into this horizontal support level has so far held, which Bollinger identifies as a potential base for a bullish reversal – although he cautions that a definitive move above the intervening swing high near $90,000 would help validate this classic chart pattern.
Other market clues include slightly lower trading volumes, suggesting that the intense selling that drove bitcoin down from its recent peak may be easing. The chart’s momentum oscillator, which tracks overbought and oversold conditions, supports this thesis, forming a bottom near its lower border. Although this alignment with price action suggests a possible bottom, many technical analysts are looking for the oscillator to rise convincingly above its midpoint to confirm that momentum has indeed shifted in favour of buyers.
Bollinger bands themselves, invented by John Bollinger, measure volatility by placing envelope lines above and below a moving average. When these bands widen, the market typically experiences large price swings; when they narrow, volatility decreases. In Bitcoin’s case, they’ve remained relatively wide, reflecting the cryptocurrency’s dramatic range from below $20,000 to six figures over the past two years.
While talk of a W-bottom has sparked optimism among bullish traders, Bollinger’s reminder that it “still needs to be confirmed” highlights the importance of solid follow-through in price action. If Bitcoin can break above $90,000 on robust volume, the long-awaited confirmation of this pattern would be within reach. Until then, the W-bottom is just a possibility.
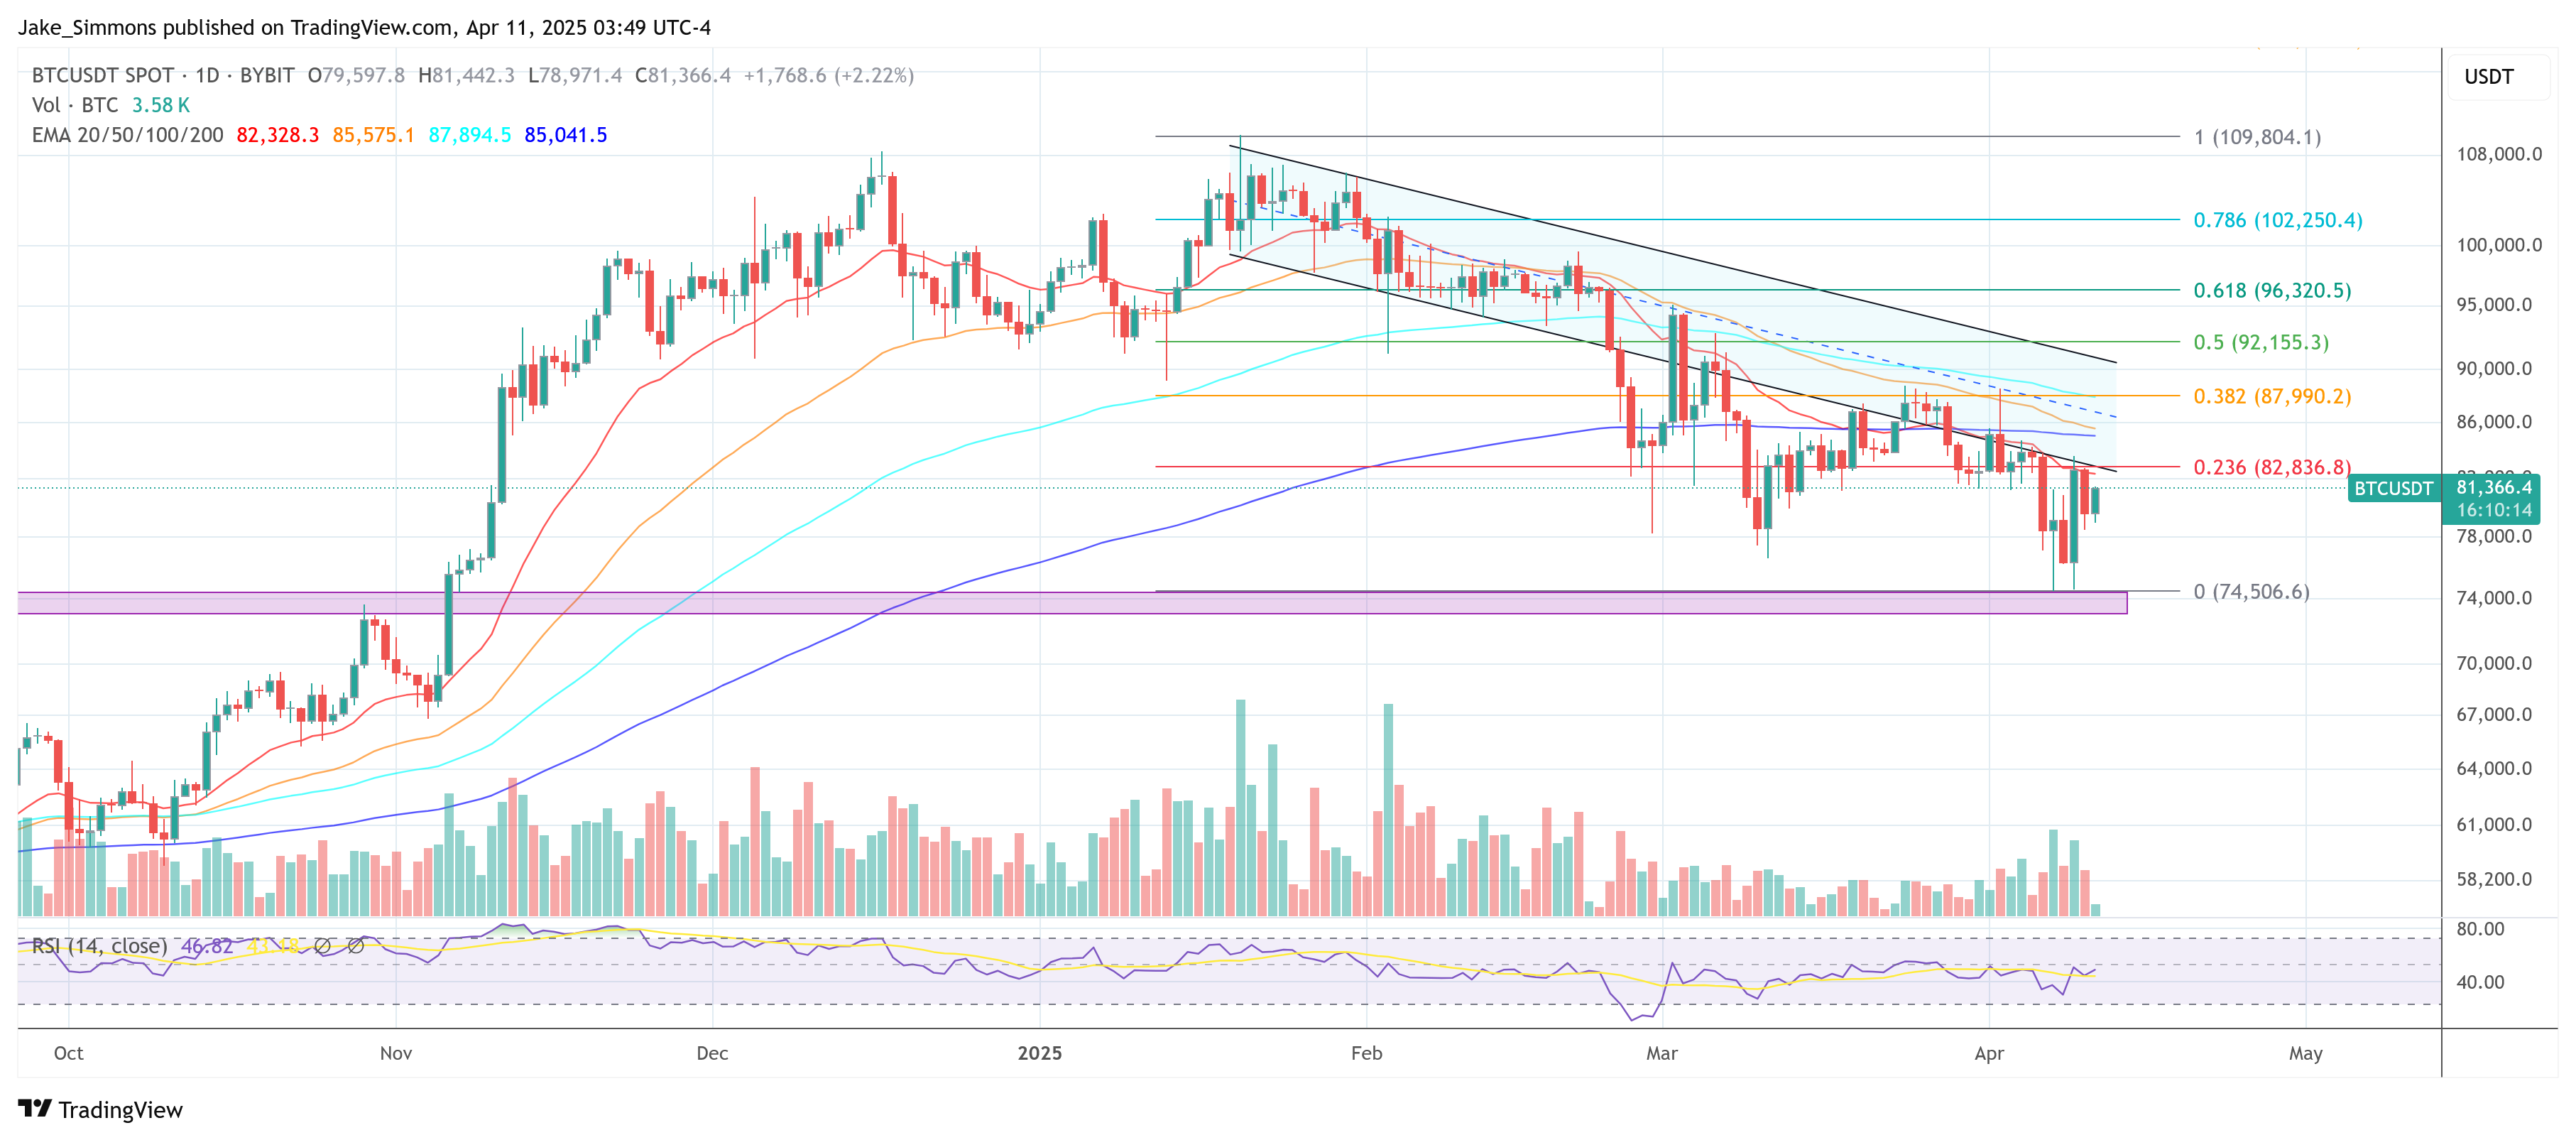
At press time, BTC traded at $81,366.