Bitcoin price extended its increase above the $67,500 resistance. BTC tested the $68,000 resistance and is currently correcting gains.
- Bitcoin started a downside correction after it climbed toward the $68,000 resistance zone.
- The price is trading below $67,000 and the 100 hourly Simple moving average.
- There was a break below a connecting bullish trend line with support at $65,900 on the hourly chart of the BTC/USD pair (data feed from Kraken).
- The pair could start another increase unless the bears push it below $65,900.
Bitcoin Price Starts Downside Correction
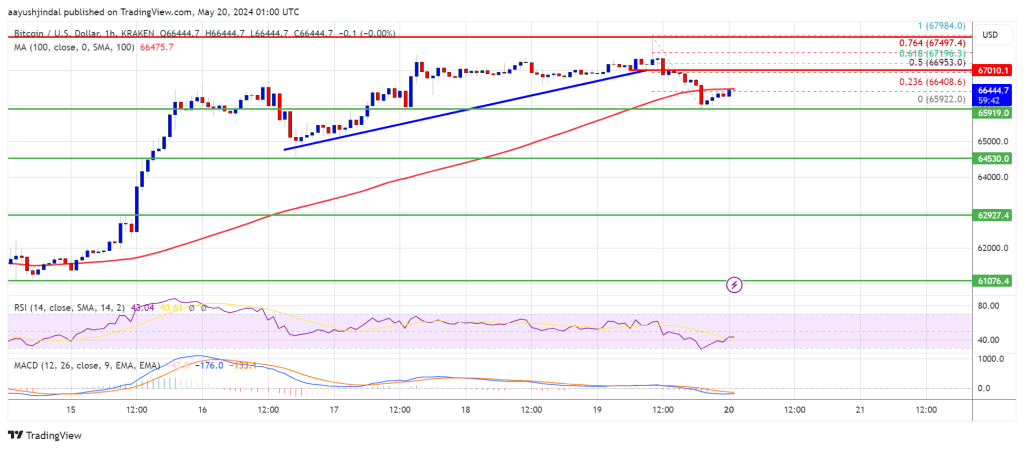
Bitcoin price remained stable above the $66,500 level. BTC extended its increase above the $67,200 and $67,500 resistance levels. It traded to a new weekly high at $67,984 and recently started a downside correction.
There was a move below the $67,000 support zone. Besides, there was a break below a connecting bullish trend line with support at $65,900 on the hourly chart of the BTC/USD pair. The pair even dipped below the $66,500 support zone.
Bitcoin price is now trading below $67,000 and the 100 hourly Simple moving average. A low was formed at $65,922 and the price is now attempting a fresh increase.
There was a move above the $66,200 level. The price climbed above the 23.6% Fib retracement level of the downside correction from the $67,984 swing high to the $65,922 low. The price is now facing resistance near the $66,500 level and the 100 hourly Simple moving average.
The first major resistance could be $66,950. It is near the 50% Fib retracement level of the downside correction from the $67,984 swing high to the $65,922 low. The next key resistance could be $67,500. A clear move above the $67,500 resistance might send the price higher. In the stated case, the price could rise and test the $68,000 resistance.
If the bulls remain in action, the price could rise toward the $68,800 resistance zone. Any more gains might send BTC toward the $70,000 barrier.
Another Decline In BTC?
If Bitcoin fails to climb above the $66,500 resistance zone, it could continue to move down. Immediate support on the downside is near the $66,000 level and the trend line.
The first major support is $65,500. The main support is now forming near $64,500. Any more losses might send the price toward the $63,150 support zone in the near term.
Technical indicators:
Hourly MACD – The MACD is now losing pace in the bullish zone.
Hourly RSI (Relative Strength Index) – The RSI for BTC/USD is now below the 50 level.
Major Support Levels – $65,900, followed by $65,500.
Major Resistance Levels – $66,500, $67,000, and $67,500.


