Bitcoin price is slowly losing momentum and struggling below $70,000. BTC is now consolidating and facing hurdles near the $69,500 resistance zone.
- Bitcoin is facing many key hurdles near the $70,000 zone.
- The price is trading above $69,500 and the 100 hourly Simple moving average.
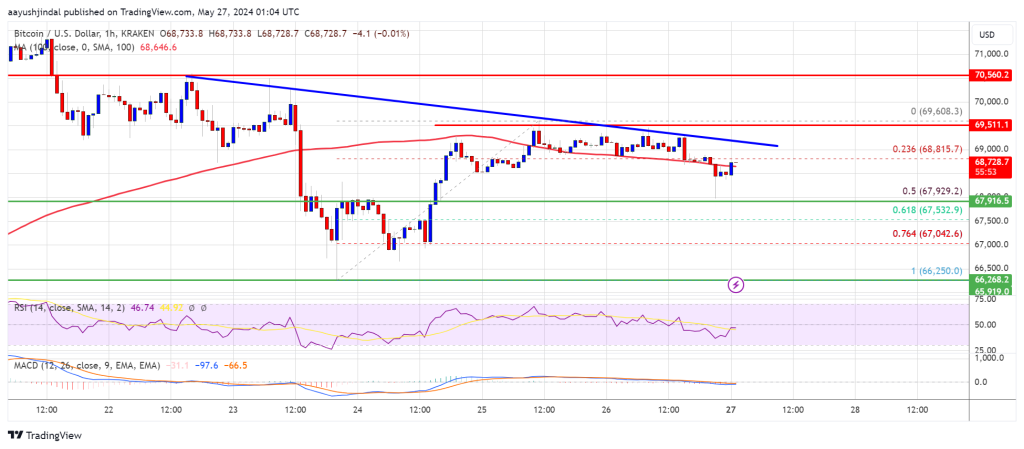
- There is a key bearish trend line forming with resistance at $69,100 on the hourly chart of the BTC/USD pair (data feed from Kraken).
- The pair could continue to move down if it stays below the $70,000 zone.
Bitcoin Price Stuck Below $70K
Bitcoin price found support above the $66,000 level and started another increase. BTC was able to clear the $68,000 resistance zone. However, the bears were active near the $69,500 and $70,000 levels.
A high was formed near $69,608 and the price is now correcting gains. There was a move below the 23.6% Fib retracement level of the upward move from the $66,250 swing low to the $69,608 high. It even tested the $68,000 support zone.
The bulls are now active near the 50% Fib retracement level of the upward move from the $66,250 swing low to the $69,608 high. Bitcoin price is trading above $69,500 and the 100 hourly Simple moving average.
If there is a fresh increase, the price might face resistance near the $69,000 level. There is also a key bearish trend line forming with resistance at $69,100 on the hourly chart of the BTC/USD pair. The first major resistance could be $69,500.
The next key resistance could be $70,000. A clear move above the $70,000 resistance might send the price higher. In the stated case, the price could rise and test the $71,200 resistance. Any more gains might send BTC toward the $72,000 resistance.
More Losses In BTC?
If Bitcoin fails to climb above the $69,500 resistance zone, it could continue to move down. Immediate support on the downside is near the $68,000 level.
The first major support is $67,500. The next support is now forming near $67,000. Any more losses might send the price toward the $65,500 support zone in the near term.
Technical indicators:
Hourly MACD – The MACD is now losing pace in the bearish zone.
Hourly RSI (Relative Strength Index) – The RSI for BTC/USD is now below the 50 level.
Major Support Levels – $67,500, followed by $67,000.
Major Resistance Levels – $69,100, and $69,500.


