Bitcoin Price Prediction – April 19
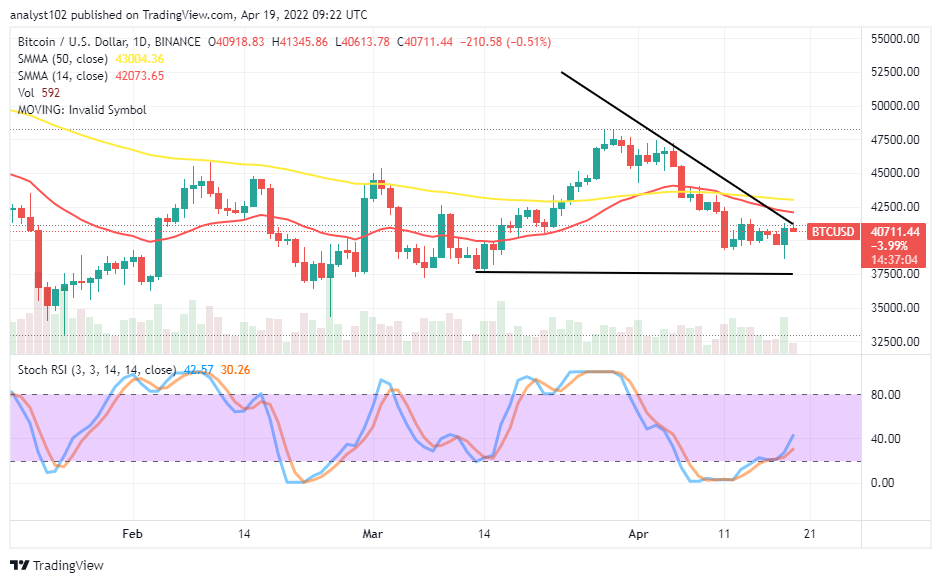
There have been variant ups and downs underneath the bearish trend line drawn in the activities involving Bitcoin and the US Dollar for a while. The actual trading outlook shows the BTC market moves in a range setting, trading around $40,711 at a negative percentage of 0.51.
BTC/USD Market
Key Levels:
Resistance levels: $42,500, $45,000, $47,500
Support levels: $37,500, $35,000, $32,500 BTC/USD – Daily Chart
The daily chart showcases the BTC market moves in a range set against the valuation of the US Dollar. The settings have been below the sell signal of the SMA trend lines. The 14-day SMA indicator intercepts the 50-day SMA from the top to the downside. And they are both around the $42,500 resistant trading spot. The $37,500 support level represents the critical line against any possible decline force. The Stochastic Oscillators are relatively positioned northbound around the 40 range line to signify a buying mode is ongoing.
Should buyers wait for a breakout at the $42,500 resistance level before joining the trend as the BTC market moves in a range setting?
It may be safe for the BTC/USD market buyers to join the trend tends to emanate from a sudden breakout of the $42,500 resistance, provided the scenario doesn’t witness a quick correctional-moving mode in the course of that assumption happening almost immediately. At this point, using both the 1-hour and 4-hour trading charts will be of paramount help to determine decent entries for buying-trading position when the price falls to a lower zone.
On the downside of the technical analysis, the BTC/USD market short-position placers tend to rebuild a resistance against letting the crypto rise freely to the north side. Successive northward pushes may come upon the current signal positioning to the northbound of the Stochastic Oscillators. If that assumption turns out to be valid, it would be ideally psychological to suspend a selling order until an overbought-trading moment occurs afterward.
BTC/USD 4-hour Chart
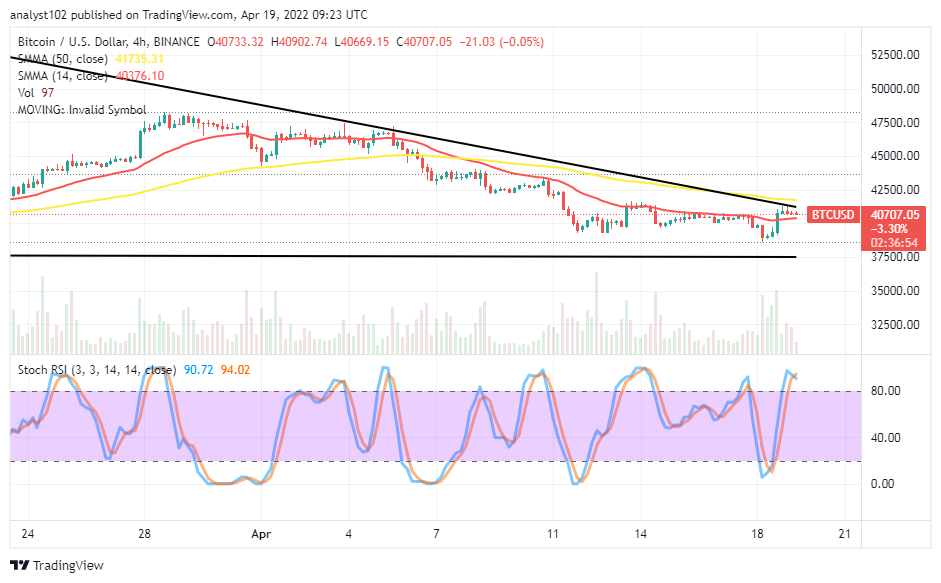
The medium-term chart shows the BTC market moves in a range setting, involving the $40,000 psychological spot. The 50-day SMA indicator is around the bearish trend line above the 14-day SMA indicator. The Stochastic Oscillators are in the overbought region, seemingly attempting to cross their lines southbound within. That suggests the crypto may not have it smoother to push more past the $42,500 resistance level in the near session.
Looking to buy or trade Bitcoin (BTC) now? Invest at eToro!
68% of retail investor accounts lose money when trading CFDs with this provider.
Read more:


