The Bitcoin price prediction is currently consolidating and seems to be preparing for the next move above the resistance level of $39,000.
BTC/USD Long-term Trend: Bearish (Daily Chart)
Key levels:
Resistance Levels: $44,000, $46,000, $48,000
Support Levels: $35,000, $33,000, $31,000
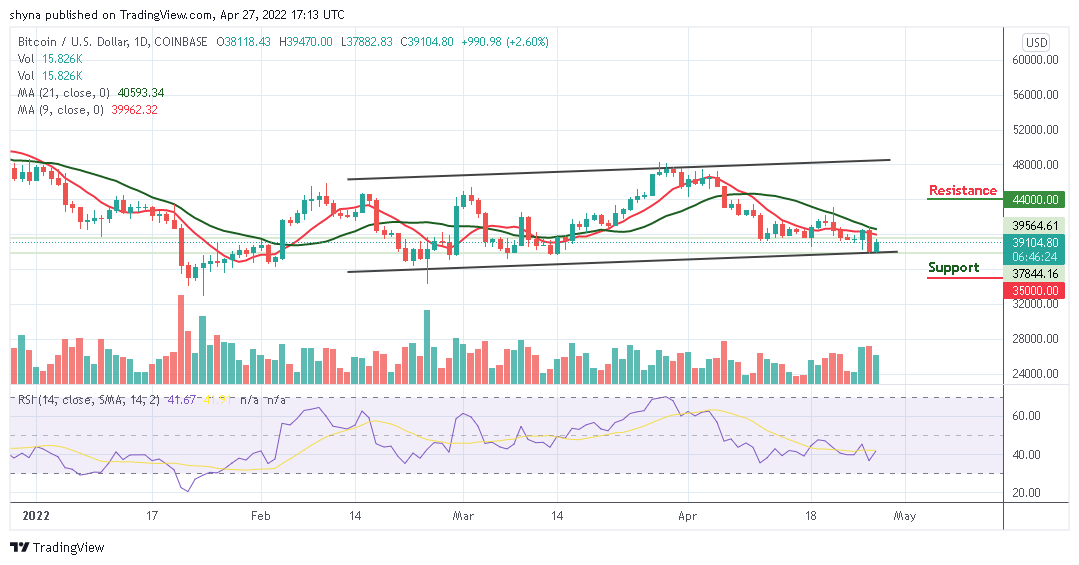
The daily chart reveals that BTC/USD couldn’t break the resistance level of $39,500 with the current consolidation pattern as it fails to cross above the 9-day moving average. The Bitcoin (BTC) begins the day off by trending higher toward the north only to roll over and fall lower to trade back inside the channel. In the meantime, the first level of support could be located at around $37,000. Beneath this, supports lie at $35,000, $33,000, and $31,000.
Bitcoin Price Prediction: Bitcoin (BTC) May Consolidate
The Bitcoin price remains below the 9-day and 21-day moving averages as the king coin moves toward the north. However, a break above this barrier may set Bitcoin up to reach the $40,000 level. On the next positive move, traders can see BTC likely to break up to the upside. Although the candle is still yet to close, however, it does look that the bulls may end up closing above the 9-day moving average as the potential resistance levels could be located at $35,000, $33,000, and $31,000.
BTC/USD Medium-Term Trend: Bearish (4H Chart)
Looking at the 4-hour chart, BTC/USD may need to stay above $39,000 and move towards the upper boundary of the channel to mitigate the short-term bearish pressure in other to hit the nearest resistance level of $40,000. However, this psychological barrier may be closely followed by $41,000 and $42,000 resistance levels.
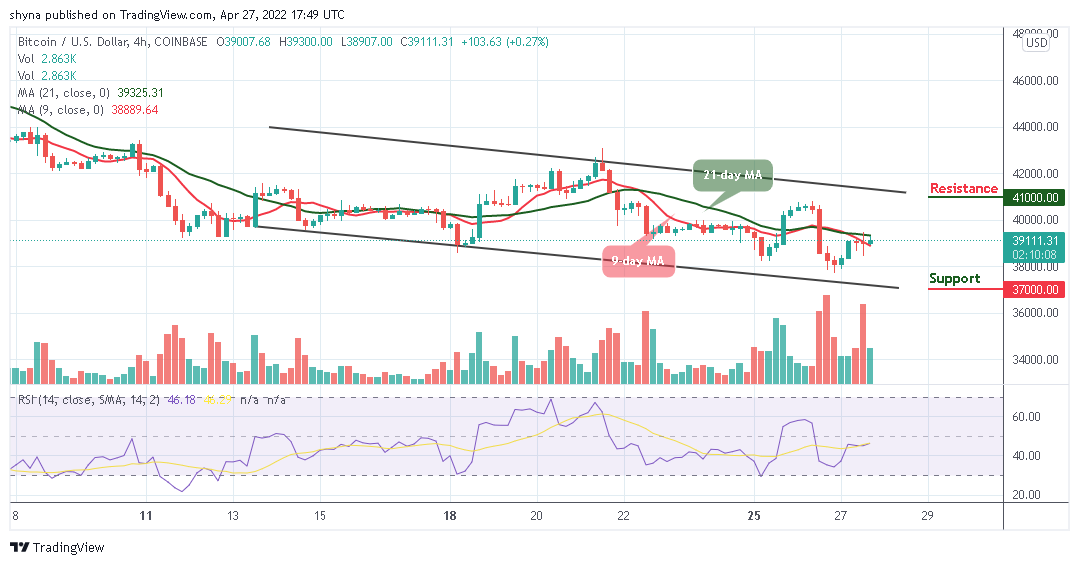
On the contrary, the nearest support may come at $38,000, and a sustainable move lower will increase the downside pressure and push the price towards $37,000 and $36,000 support levels. Considering that the technical indicator Relative Strength Index (14) on a 4-hour chart is starting to revert to the upside as traders might expect that the bull’s case scenario may come to play.
Looking to buy or trade Bitcoin (BTC) now? Invest at eToro!
68% of retail investor accounts lose money when trading CFDs with this provider
Read more:


