At the time of writing, the Bitcoin price prediction is dropping over 1.60% within 24 hours as it trades at the $38,773 level.
Bitcoin Prediction Statistics Data:
Bitcoin price now – $30,027
Bitcoin market cap – $572.3 billion
Bitcoin circulating supply – 19.0 million
Bitcoin total supply – 19.0 million
Bitcoin Coinmarketcap ranking – #1
BTC/USD Long-term Trend: Bearish (Daily Chart)
Key levels:
Resistance Levels: $36,000, $38,000, $40,000
Support Levels: $25,000, $23,000, $21,000
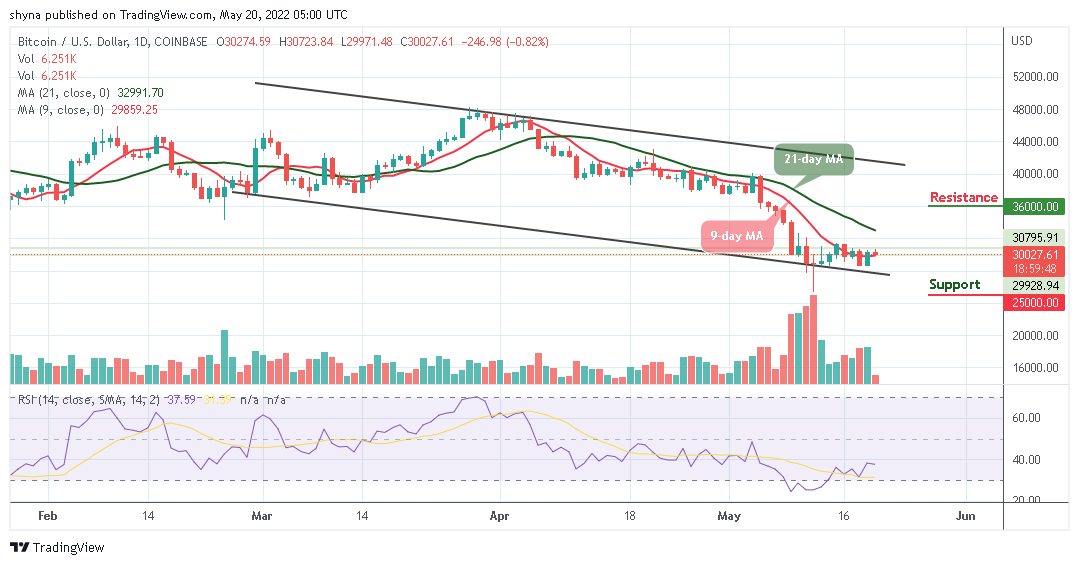
The daily chart reveals that BTC/USD failed to break above the previous resistance level of $31,000. Moreover, the Bitcoin (BTC) begins the day off by trending lower towards the support level of $30,000 and probably crossing below the 9-day and 21-day moving averages. However, the first support level is $28,000. Beneath this, other supports lie at $25,000, $23,000, and $21,000.
Bitcoin Price Prediction: Bitcoin (BTC) May Consolidate to the Downside
Today’s trading marks another day that the Bitcoin price fails to stay above the 9-day moving average as it looks to set up another few days of negative price declines beneath $30,000. Meanwhile, a break above the opening price of $30,274 would have set the king coin up to reach the nearest resistance at the $32,000 level. In other words, traders can see Bitcoin fails to break up as the technical indicator Relative Strength Index (14) may remain below 40-level.
However, the Bitcoin price couldn’t go higher as it is dropping towards the lower boundary of the channel. More so, should the technical indicator slide to the downside, the market price may end on the negative side, but on the contrary, crossing above the 21-day moving average could meet the resistance levels at $36,000, $38,000, and $40,000.
BTC/USD Medium-Term Trend: Ranging (4H Chart)
The 4-hour chart reveals that bulls are likely to come back into the market if the coin moves to cross above the upper boundary of the channel. Therefore, if the bulls put more pressure, the Bitcoin price may hit the resistance level of $33,000 and above.
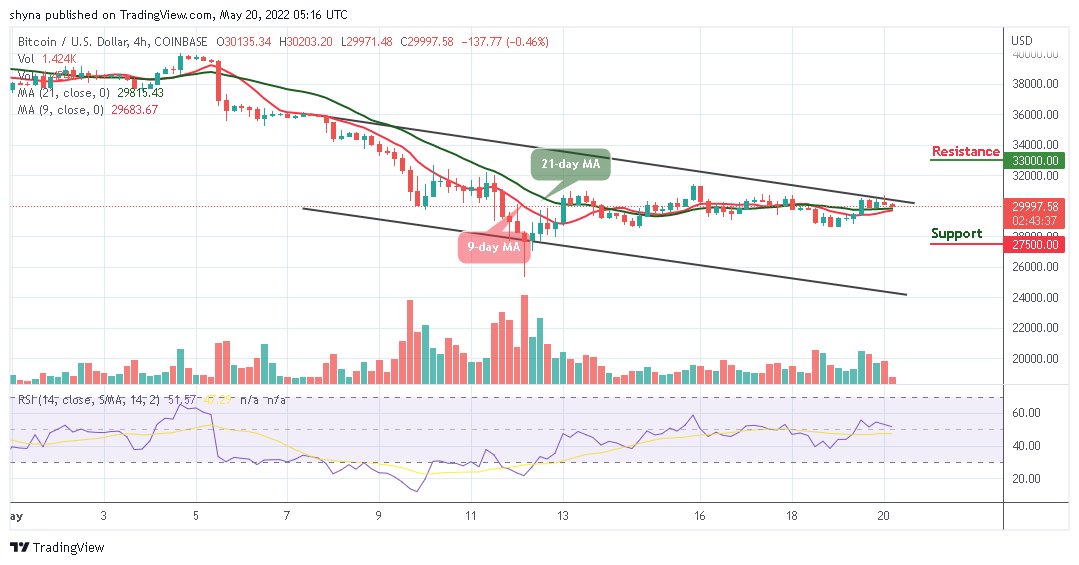
Nevertheless, if the sellers bring the current market value below the 9-day and 21-day moving averages, breaking this barrier may further allow the coin to hit the support at $27,500 and below. At the moment, the technical indicator Relative Strength Index (14) may likely cross below the 50-level to give additional bearish signals to the market.
Looking to buy or trade Bitcoin (BTC) now? Invest at eToro!
68% of retail investor accounts lose money when trading CFDs with this provider
Read more:


