Bitcoin price failed to clear the $17,300 zone and corrected lower. BTC could find a strong buying interest near $16,900 or $16,700 in the coming sessions.
- Bitcoin failed to gain pace for a move above $17,300 and $17,450.
- The price is trading below $17,000 and the 100 hourly simple moving average.
- There is a key bearish trend line forming with resistance near $17,150 on the hourly chart of the BTC/USD pair (data feed from Kraken).
- The pair could bounce back if it stays above the $16,900 and $16,700 support levels.
Bitcoin Price Remains Supported
Bitcoin price was able to clear the $17,000 resistance zone. However, the price failed to gain pace for a move above $17,300 and $17,450. A high was formed near $17,292 and the price started a fresh decline.
There was a clear move below the $17,100 and $17,000 levels. The price declined below the 50% Fib retracement level of the upward move from the $16,700 swing low to $17,292 high. Bitcoin price is now trading below $17,000 and the 100 hourly simple moving average.
There is also a key bearish trend line forming with resistance near $17,150 on the hourly chart of the BTC/USD pair. The pair is now approaching the 61.8% Fib retracement level of the upward move from the $16,700 swing low to $17,292 high.
On the upside, an immediate resistance is near the $17,050 level. The first major resistance is near the $17,150 zone and the trend line, above which the price may perhaps start a fresh increase.
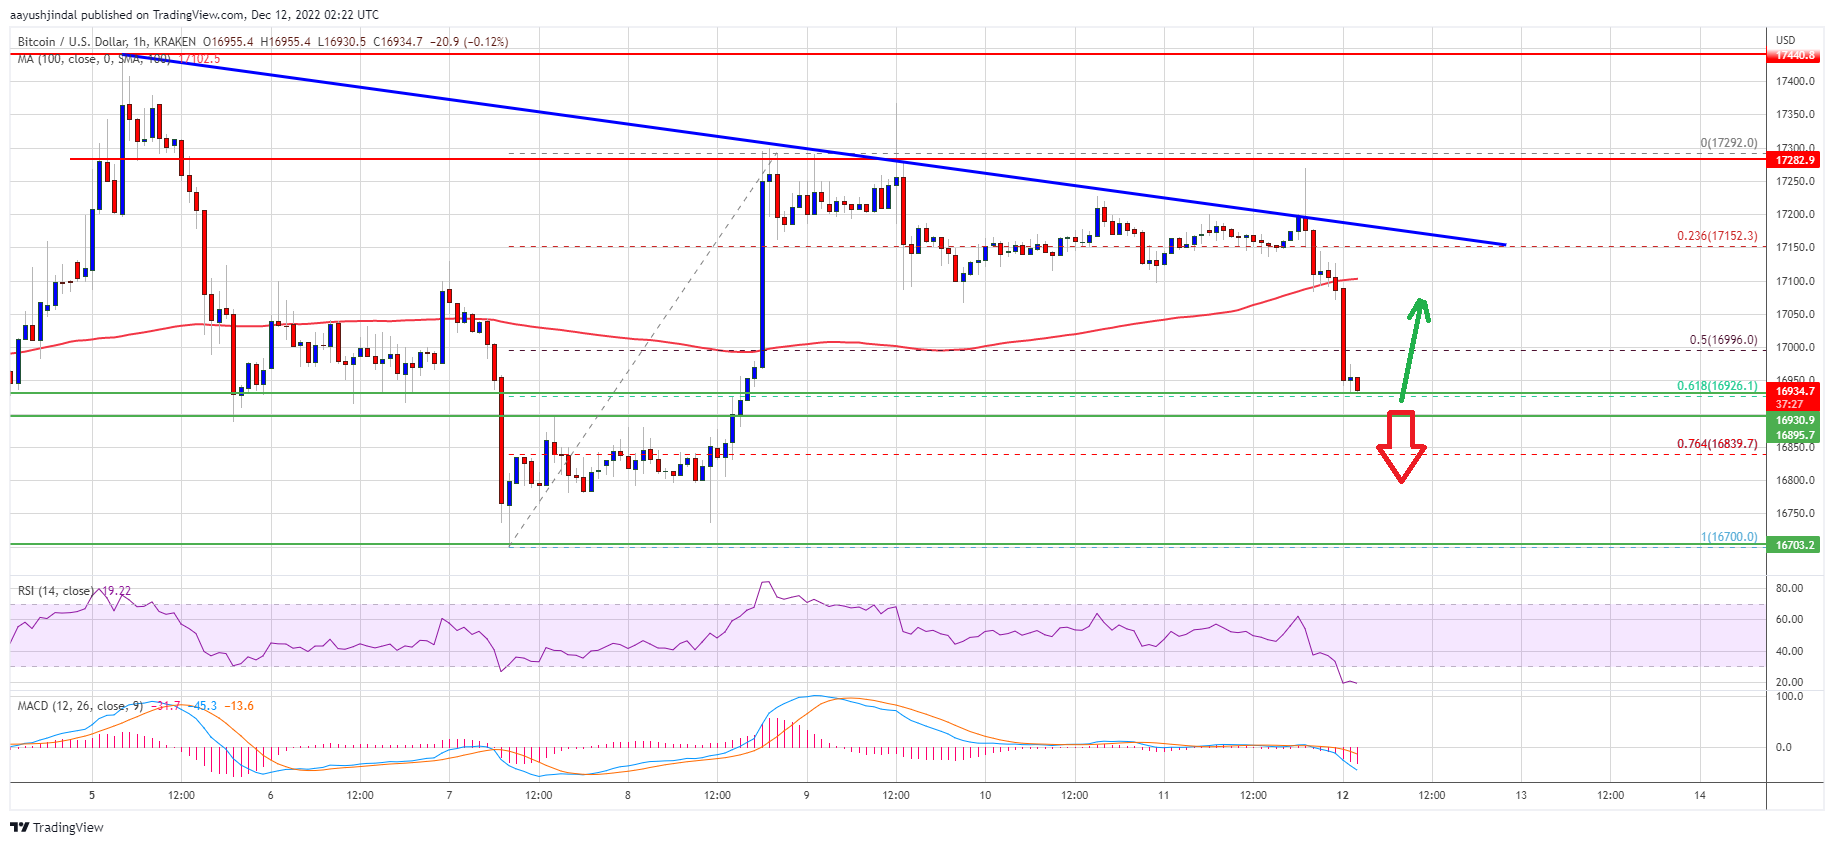
Source: BTCUSD on TradingView.com
In the stated case, the price could rise towards the $17,300 resistance. The next major resistance is near $17,450, above which the price rise towards the $18,000 zone in the near term.
Downside Break in BTC?
If bitcoin fails to clear the $17,150 resistance, there could be more losses. An immediate support on the downside is near the $16,900 level.
The next major support is near the $16,700 zone or the last swing low. A downside break below the $16,700 support might call a drop towards $16,500. Any more losses might push the price towards the $16,200 zone in the near term.
Technical indicators:
Hourly MACD – The MACD is now gaining pace in the bearish zone.
Hourly RSI (Relative Strength Index) – The RSI for BTC/USD is now in the oversold zone.
Major Support Levels – $16,900, followed by $16,700.
Major Resistance Levels – $17,050, $17,150 and $17,450.


