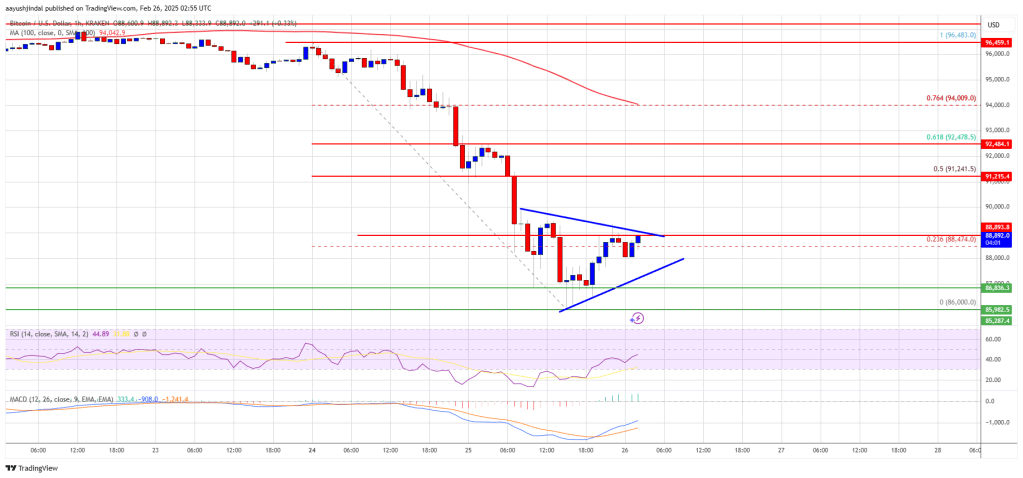
Bitcoin price started a fresh decline below the $90,000 support. BTC must stay above the $86,000 zone to avoid more losses in the near term.
- Bitcoin started a fresh decline from the $95,500 zone.
- The price is trading below $90,000 and the 100 hourly Simple moving average.
- There is a short-term triangle forming with resistance at $89,000 on the hourly chart of the BTC/USD pair (data feed from Kraken).
- The pair could start another decline if it fails to stay above the $90,000 zone.
Bitcoin Price Dips Sharply
Bitcoin price failed to stay above the $95,500 level and started a fresh decline. BTC declined heavily below the $93,200 and $92,200 support levels.
The price even dived below the $90,000 level. It tested the $86,000 zone. A low was formed at $86,000 and the price is now consolidating losses. It is back above the $88,500 level and the 23.6% Fib retracement level of the downward move from the $96,482 swing high to the $86,000 low.
Bitcoin price is now trading below $91,200 and the 100 hourly Simple moving average. On the upside, immediate resistance is near the $89,000 level. There is also a short-term triangle forming with resistance at $89,000 on the hourly chart of the BTC/USD pair.
The first key resistance is near the $90,000 level. The next key resistance could be $91,250 or the 50% Fib retracement level of the downward move from the $96,482 swing high to the $86,000 low.
A close above the $91,250 resistance might send the price further higher. In the stated case, the price could rise and test the $93,500 resistance level. Any more gains might send the price toward the $95,000 level or even $96,400.
Another Decline In BTC?
If Bitcoin fails to rise above the $90,000 resistance zone, it could start a fresh decline. Immediate support on the downside is near the $88,000 level. The first major support is near the $87,250 level.
The next support is now near the $86,000 zone. Any more losses might send the price toward the $85,000 support in the near term. The main support sits at $83,200.
Technical indicators:
Hourly MACD – The MACD is now losing pace in the bearish zone.
Hourly RSI (Relative Strength Index) – The RSI for BTC/USD is now below the 50 level.
Major Support Levels – $88,000, followed by $86,000.
Major Resistance Levels – $90,000 and $91,250.


