Bitcoin has surged past its all-time high again, reaching an impressive $108,300 and solidifying its position as the market leader. This rally marks a continuation of Bitcoin’s push into price discovery, fueled by growing investor demand and positive global market sentiment.
Notably, many major markets, including U.S. stocks and gold, are also experiencing upward momentum, creating a favorable macroeconomic environment for Bitcoin’s price action.
Top CryptoQuant analyst Axel Adler recently highlighted Bitcoin’s renewed strong correlation with the S&P 500 index, which currently stands at 83%. This connection underscores how BTC is increasingly viewed as a risk-on asset, moving in tandem with traditional financial markets. Adler’s analysis suggests that Bitcoin’s price performance could continue to mirror broader market trends, potentially leading to even greater heights if global equities maintain their bullish trajectory.
As Bitcoin navigates this historic rally, analysts and investors closely monitor the market for clues about its next moves. With global markets aligned and BTC maintaining strong correlations, the stage is set for further price discovery. However, all eyes remain on whether BTC can sustain its momentum and reach new highs in the coming weeks.
Bitcoin Joins Traditional Markets
Bitcoin has evolved from a niche digital asset to a globally accepted store of value, with its increasing mainstream adoption playing a key role in its market movements. Over the past four years, Bitcoin’s price action has often mirrored broader market trends, especially during strong growth in traditional assets like the S&P 500 and NASDAQ. This growing relationship highlights Bitcoin’s transition into a risk-on asset, now seen as part of a larger global financial ecosystem.
Top CryptoQuant analyst Axel Adler recently shared important insights revealing that BTC is once again strongly correlated with the S&P 500, with the current correlation at an impressive 83%.
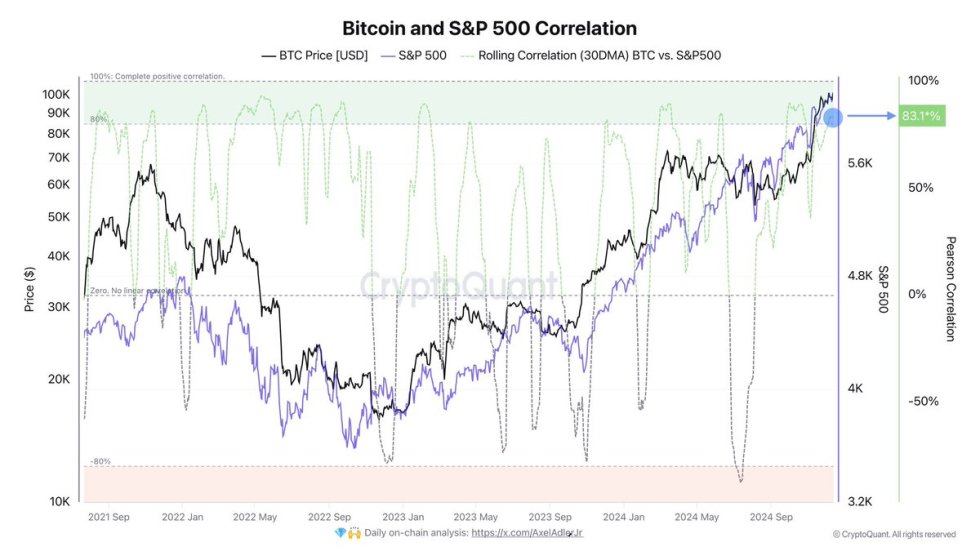
This marks a significant shift from September, when the correlation was a negative 80%. During that time, BTC was undergoing a correction while the S&P 500 was pushing toward a new all-time high. The negative correlation observed back then reflected a market divergence, with BTC and traditional equities moving in opposite directions.
Typically, a high positive correlation between Bitcoin and the S&P 500 signals that both markets are trending in the same direction, often due to shared macroeconomic factors like investor sentiment and global economic conditions.
The current positive correlation suggests that Bitcoin’s rise is in tandem with the broader financial market’s bullish momentum, which bodes well for further price discovery. As both markets continue to climb, BTC may experience even stronger upward movement, benefiting from the continued growth of global equities.
BTC Visits Uncharted Territory
Bitcoin is trading at $105,200, showing strong momentum after a solid bounce from the previous all-time high (ATH) at the $103,400 level. This bounce is a bullish signal, indicating that BTC maintains its upward trajectory and continues to push into price discovery. BTC holding above this key support level highlights growing investor confidence, suggesting that further gains are likely in the coming days.
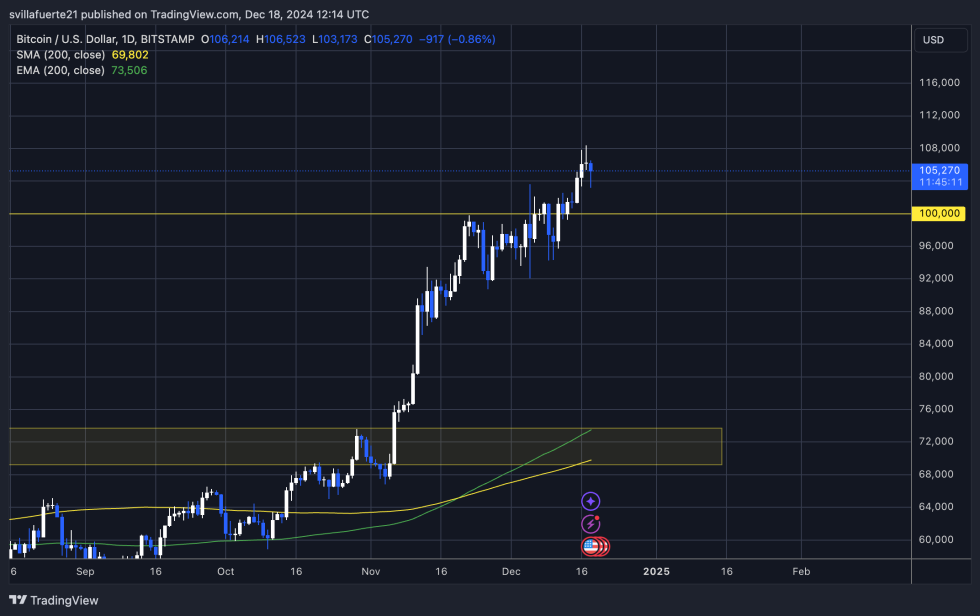
If BTC can hold above the critical $104,000 mark in the short term, it would pave the way for a challenge to the $110,000 level. A successful move past $110,000 would mark a new milestone in Bitcoin’s price action, potentially leading to further exploration of uncharted territory.
However, if selling pressure begins to intensify, BTC may experience a retrace back to the $100,000 mark. This level could act as key support, offering a chance for the market to find demand before continuing its rally. Overall, Bitcoin remains in a strong uptrend, and the next few days will be crucial in determining whether it can continue pushing toward new highs or face a temporary pullback.
Featured image from Dall-E, chart from TradingView


