According to the candlestick arrangement in the daily chart, Bitcoin is moving inside a range. BTC is also down roughly 20% from the all-time high at spot rates. Though the series of lower lows posted in the past few trading days is bearish, one analyst is upbeat, expecting an encouraging recovery in the sessions ahead.
This Indicator Flashes Green: Time For Bitcoin To Rally?
Taking to X, the analyst notes that the 50-day Williams %R oscillator is turning from oversold territory, signaling that the bear run could end. Historically, the indicator has accurately signaled buying opportunities whenever it turns from oversold territory.
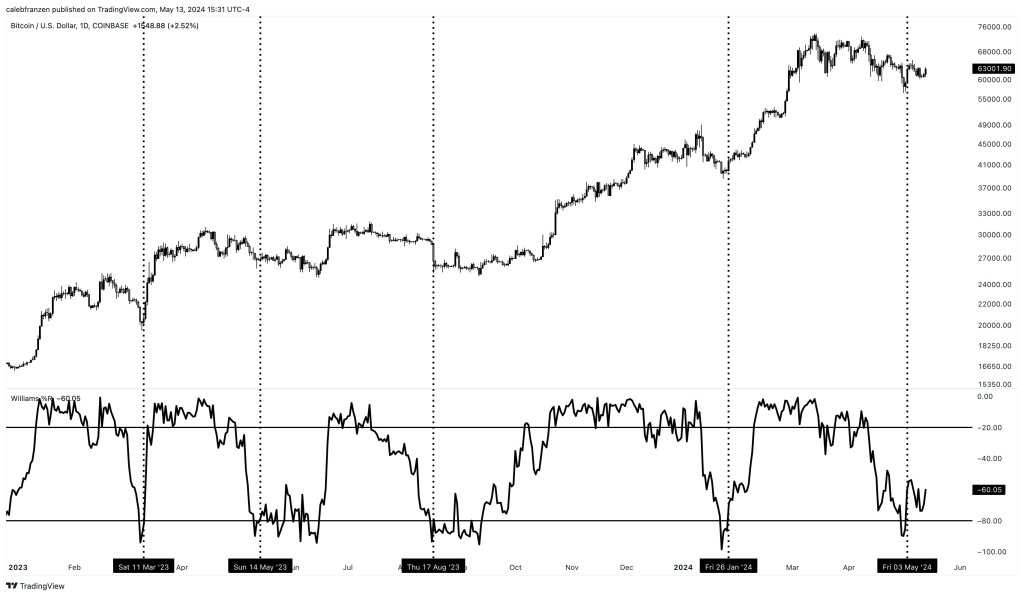
The Williams %R oscillator is a crucial technical indicator chartists use to assess momentum and identify potential oversold or overbought conditions. When the indicator falls below -80, it suggests the asset being analyzed is oversold, potentially indicating a buying opportunity. Conversely, when it rises above +20, it may mean that the asset is overbought, prompting the trader to adjust their strategy accordingly.
Since the beginning of 2023, the analyst observes that the 50-day Williams %R oscillator mapping Bitcoin prices has dipped into oversold territory on four occasions. Notably, each time the oscillator reversed from this zone, BTC prices rose in tandem.
Now, with the Williams %R oscillator returning from the oversold territory roughly ten days ago, the analyst is optimistic. It returned from the oversold territory in January 2024, preceding the bull run in Q1 2024.
If past performance is anything to go by, BTC is likely ready for a leg up. Considering the extended sideways movement and lower lows since prices peaked in mid-March 2024, this development will be a massive boost for the coin.
Does BTC Stand A Chance After Extended Consolidation?
The asset has become more dynamic since the approval of spot Bitcoin exchange-traded funds (ETFs). Broader market conditions, such as regulatory changes, macroeconomic trends, and investor sentiment increasingly influence it.
Subsequently, this dynamism can impact the accuracy of technical indicators like the Williams % R oscillator. This tool lags and doesn’t factor in events in real time. Therefore, while the oscillator has been reliable in the past, it may not necessarily accurately predict the future cycle.
For this reason, the coming days and weeks will be crucial for Bitcoin. If the price breaks out of its current range upwards, it could lend credence to the bullish interpretation.
Currently, BTC is in a narrow range. According to the daily chart, support is at $56,500, and resistance is at $66,000.


