Bitcoin has still not become overbought according to the Mayer Multiple. Here’s the level BTC would need to breech in order to enter this territory.
Bitcoin Mayer Multiple Has A Value Of 1.37 Right Now
In a new post on X, the analytics firm Glassnode has discussed about the latest trend in the Mayer Multiple for Bitcoin. The “Mayer Multiple” here refers to an indicator that keeps track of the ratio between BTC’s spot price and its 200-day moving average (MA).
As Glassnode explains,
The 200DMA is a widely recognized tool for gauging macro bull or bear bias. The Mayer Multiple measures how far BTC is from this long-term average.
When the Mayer Multiple has a value greater than 1, it means the price of the cryptocurrency is trading above its 200-day MA. On the other hand, it being under the mark implies the asset is below this historically important level.
Now, here is the chart shared by the analytics firm, that shows the trend in the Bitcoin Mayer Multiple over the last few years:
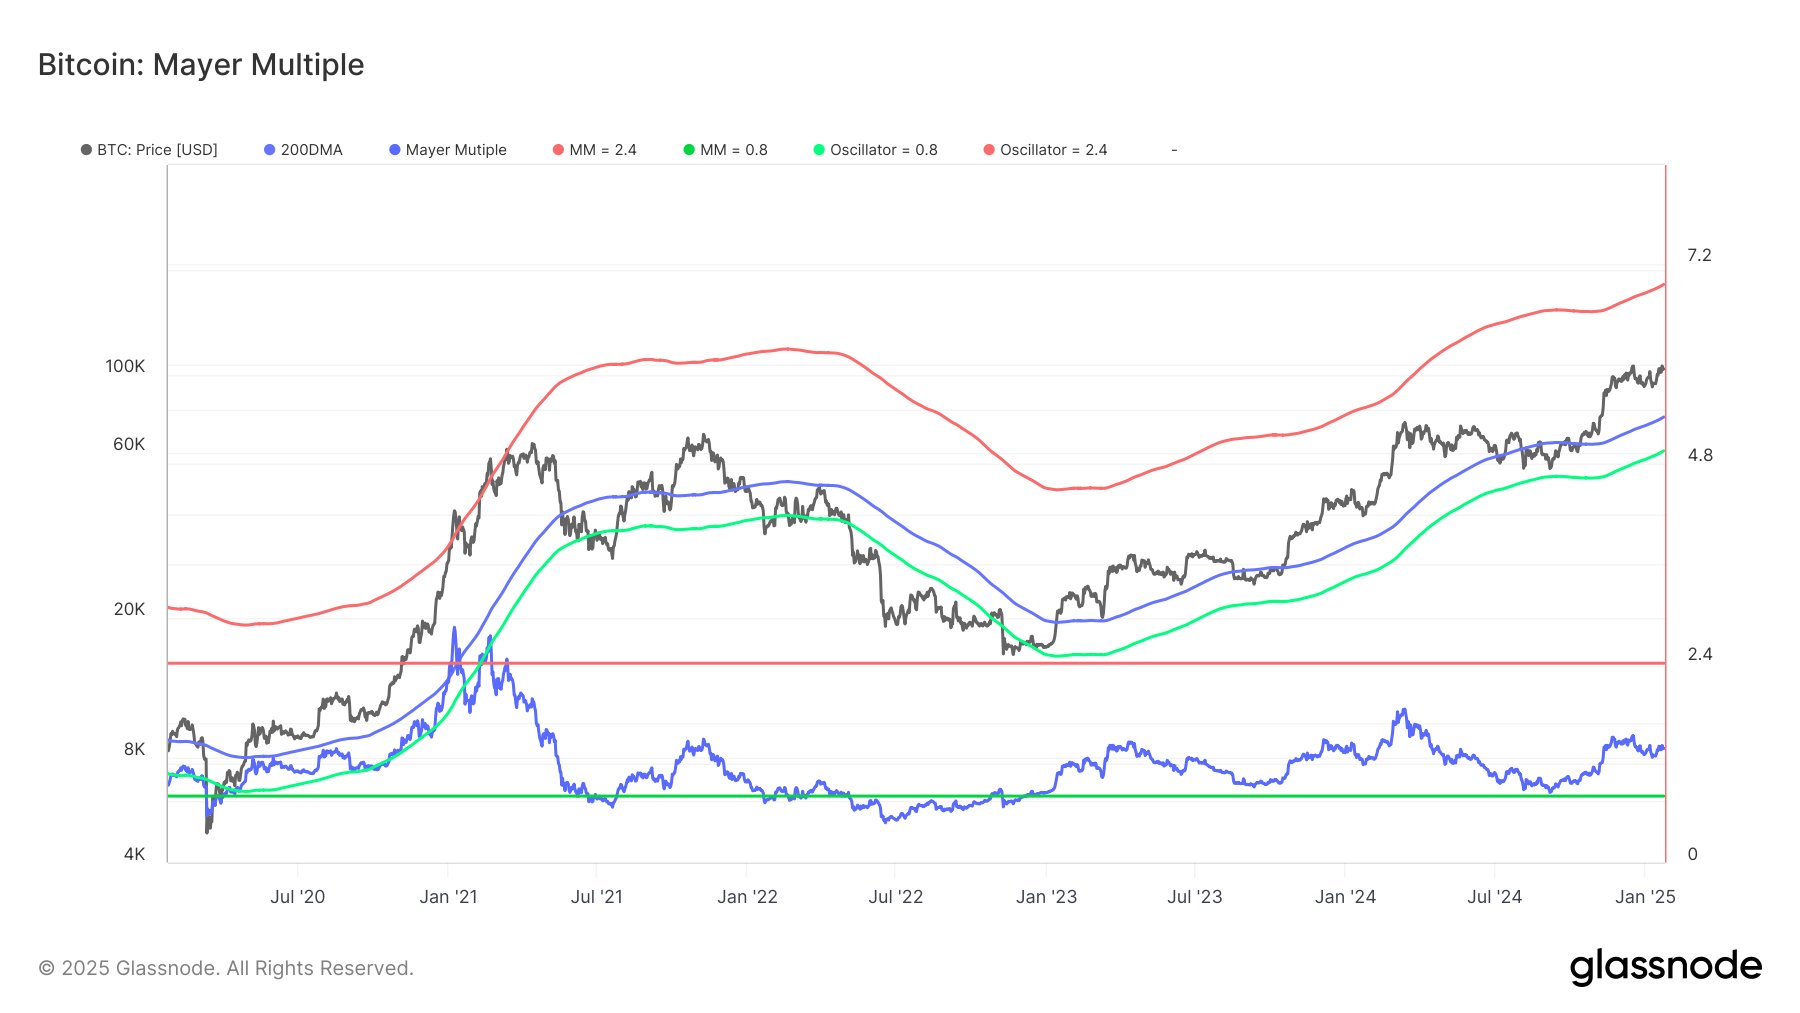
As displayed in the above graph, the Bitcoin Mayer Multiple has a value of 1.37 right now, which means that the asset has a notable distance over its 200-day MA.
In the chart, Glassnode has also highlighted three lines where the spot price of BTC would assume a Mayer Multiple equal to a historically relevant value. The green level (bottom) corresponds to the indicator assuming a value of 0.8.
BTC being under this level has generally signaled oversold conditions. The line is currently situated around $60,000, meaning that the asset would have to drop under this mark to arrive at the bottoming zone.
The red level (top) is located at $181,000 right now. At this price mark, the cryptocurrency’s Mayer Multiple would reach a value of 2.4. Going beyond this level usually implies that the asset is becoming overbought. “Although BTC is above its 200DMA, it’s quite far from the overbought territory,” notes the analytics firm.
Bitcoin would have to break the $181,000 level if it has to cross above this level in the current cycle. It only remains to be seen, though, whether the asset would breach the level in this cycle at all or if it would top out before it can happen.
The last line in the graph, the blue one in the middle, is just the 200-day MA of the asset. That is, the line where the Mayer Multiple is exactly equal to 1. BTC dipped under this level for a while during the consolidation period last year.
BTC Price
At the time of writing, Bitcoin is trading around $106,600, up almost 2% in the last seven days.


