Bitcoin experienced an explosive surge yesterday, with bulls driving the price to a new all-time high (gain) at $89,980. This relentless uptrend highlights growing optimism among investors as Bitcoin continues to break new ground.
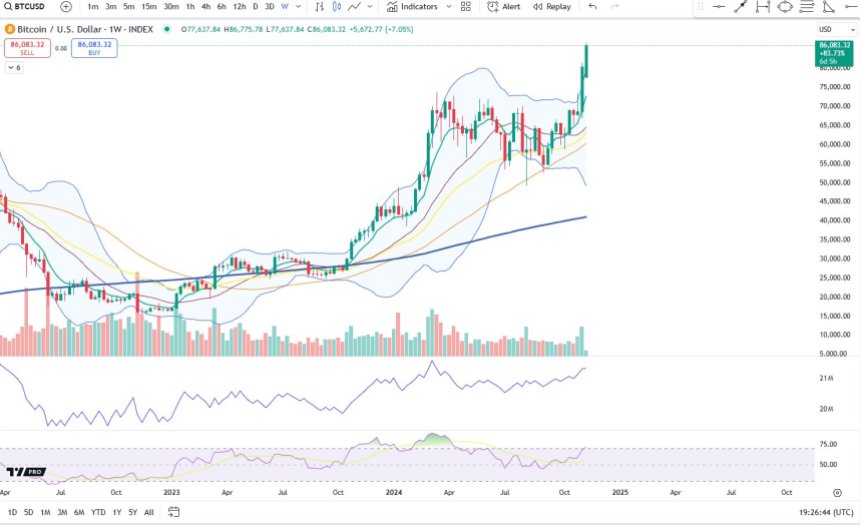
Renowned trader and analyst Cheds recently shared a compelling technical insight, noting that Bitcoin’s weekly Relative Strength Index (RSI) is nearing the “overbought” zone—historically a very bullish signal for BTC. Entering this zone could indicate heightened demand and momentum, suggesting further upside potential for Bitcoin in the near term.
The coming days will be critical as investors anticipate a possible pullback to enter fresh positions at lower levels. However, the current price action remains bullish, showing few signs of weakness.
If the price holds, it could fuel even greater buying interest, extending Bitcoin’s upward momentum. Cheds’ analysis underscores the strong technical setup for BTC, with RSI nearing a point that could attract more bullish attention. Investors will be watching closely, as any sustained movement in this high momentum phase may set the stage for Bitcoin’s next big leg up.
Bitcoin Showing Strength
Bitcoin has surged by over 32% in less than a week, with rapid, aggressive moves to new highs reflecting strong market sentiment. Such euphoria often precedes a correction, yet recent data indicates Bitcoin could sustain this upward momentum.
Top trader and analyst Cheds recently shared a technical analysis on X, highlighting that Bitcoin’s weekly Relative Strength Index (RSI) is nearing the “power zone,” known as the overbought territory. Historically, this zone has signaled powerful bullish phases for BTC. The last time Bitcoin’s RSI reached similar levels, the price rallied from around $40,000 to $70,000, suggesting another substantial surge might be on the horizon.
As Bitcoin enters this new bullish phase, a continuation of the uptrend seems likely, but it may not be a straightforward climb. Even in strong bull markets, BTC typically requires periodic pullbacks to consolidate and gather strength for further gains.
A healthy retrace would provide necessary support levels and allow BTC to “refuel” before another upward push. This retracement is particularly important in avoiding overstretched conditions that could lead to a more severe correction.
While the current bullish momentum points toward higher levels, traders should anticipate some fluctuations, which are part of a sustainable uptrend. Bitcoin’s ability to hold key support levels during any potential pullback will be crucial for maintaining the overall bullish structure.
Bullish Price Action: Key Levels To Watch
Bitcoin is trading at $88,000 following two days of unexpected price appreciation, defying analysts’ expectations of a pause around $77,000 and a possible pullback to the previous all-time high of $73,800.
Instead, Bitcoin’s price has continued its upward momentum, bringing it closer to the significant psychological level of $90,000. Many investors consider this level a key supply zone where profit-taking could emerge.
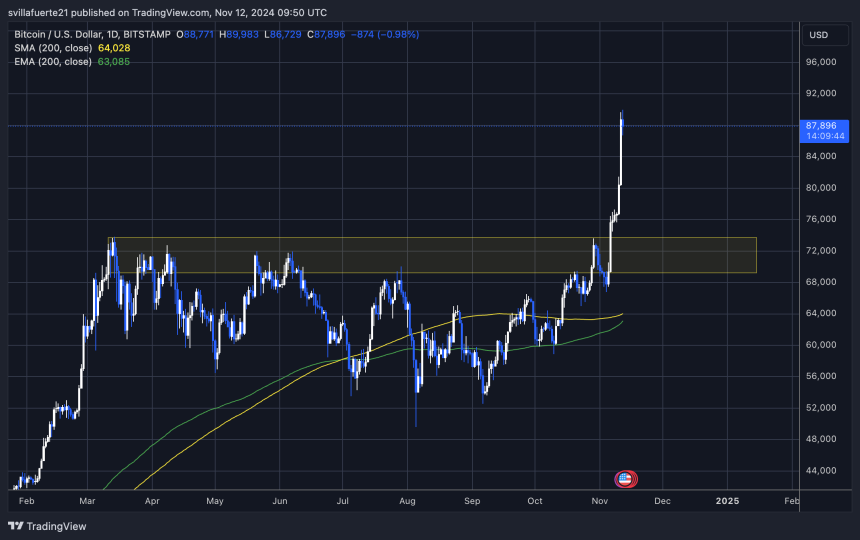
Despite the rapid climb, market sentiment remains highly bullish, and the price structure suggests that Bitcoin is still targeting the much-anticipated $100,000 milestone. The current price action reflects a strong bullish trend, but a retracement toward the $77,000 level could be a healthy move, allowing BTC to establish a robust demand base. Such a pullback would offer a consolidation phase, which is typical before another major leg-up in a sustained rally.
In the meantime, Bitcoin’s steady price action above recent highs is boosting investor confidence and keeping the overall outlook bullish, as BTC appears well-positioned for further gains.
Featured image from Dall-E, chart from TradingView


