The on-chain analytics firm Glassnode has revealed how the large Bitcoin investors have been buying during this price rally so far.
Accumulation Trend Score Suggests Strong Buying From Mega Whales
In a new post on X, Glassnode has discussed about how the Accumulation Trend Score has changed for the different Bitcoin investor cohorts recently. The “Accumulation Trend Score” refers to an on-chain indicator that basically tells us about whether the BTC holders are buying or selling.
The metric calculates its value by not only making use of the balance changes happening in the wallets of the investors, but also the size of the wallets themselves. This means that large addresses have a higher weightage in the indicator’s value.
When the Accumulation Trend Score is greater than 0.5, it suggests that the large investors (or a large number of small holders) are participating in accumulation. The closer the metric is to 1.0, the stronger is this behavior.
On the other hand, the indicator being under 0.5 implies the investors are distributing or simply not doing any buying. On this side of the scale, the zero mark acts as the point of extreme.
In the context of the current topic, the combined Accumulation Trend Score of the entire Bitcoin market isn’t of interest, but rather the separate scores for the different investor cohorts.
There are two main ways to divide holder groups: holding time and balance size. Here, the cohorts are based on the latter categorization. Below is the chart shared by the analytics firm that shows the trend in the Accumulation Trend Score for these groups over the past year.
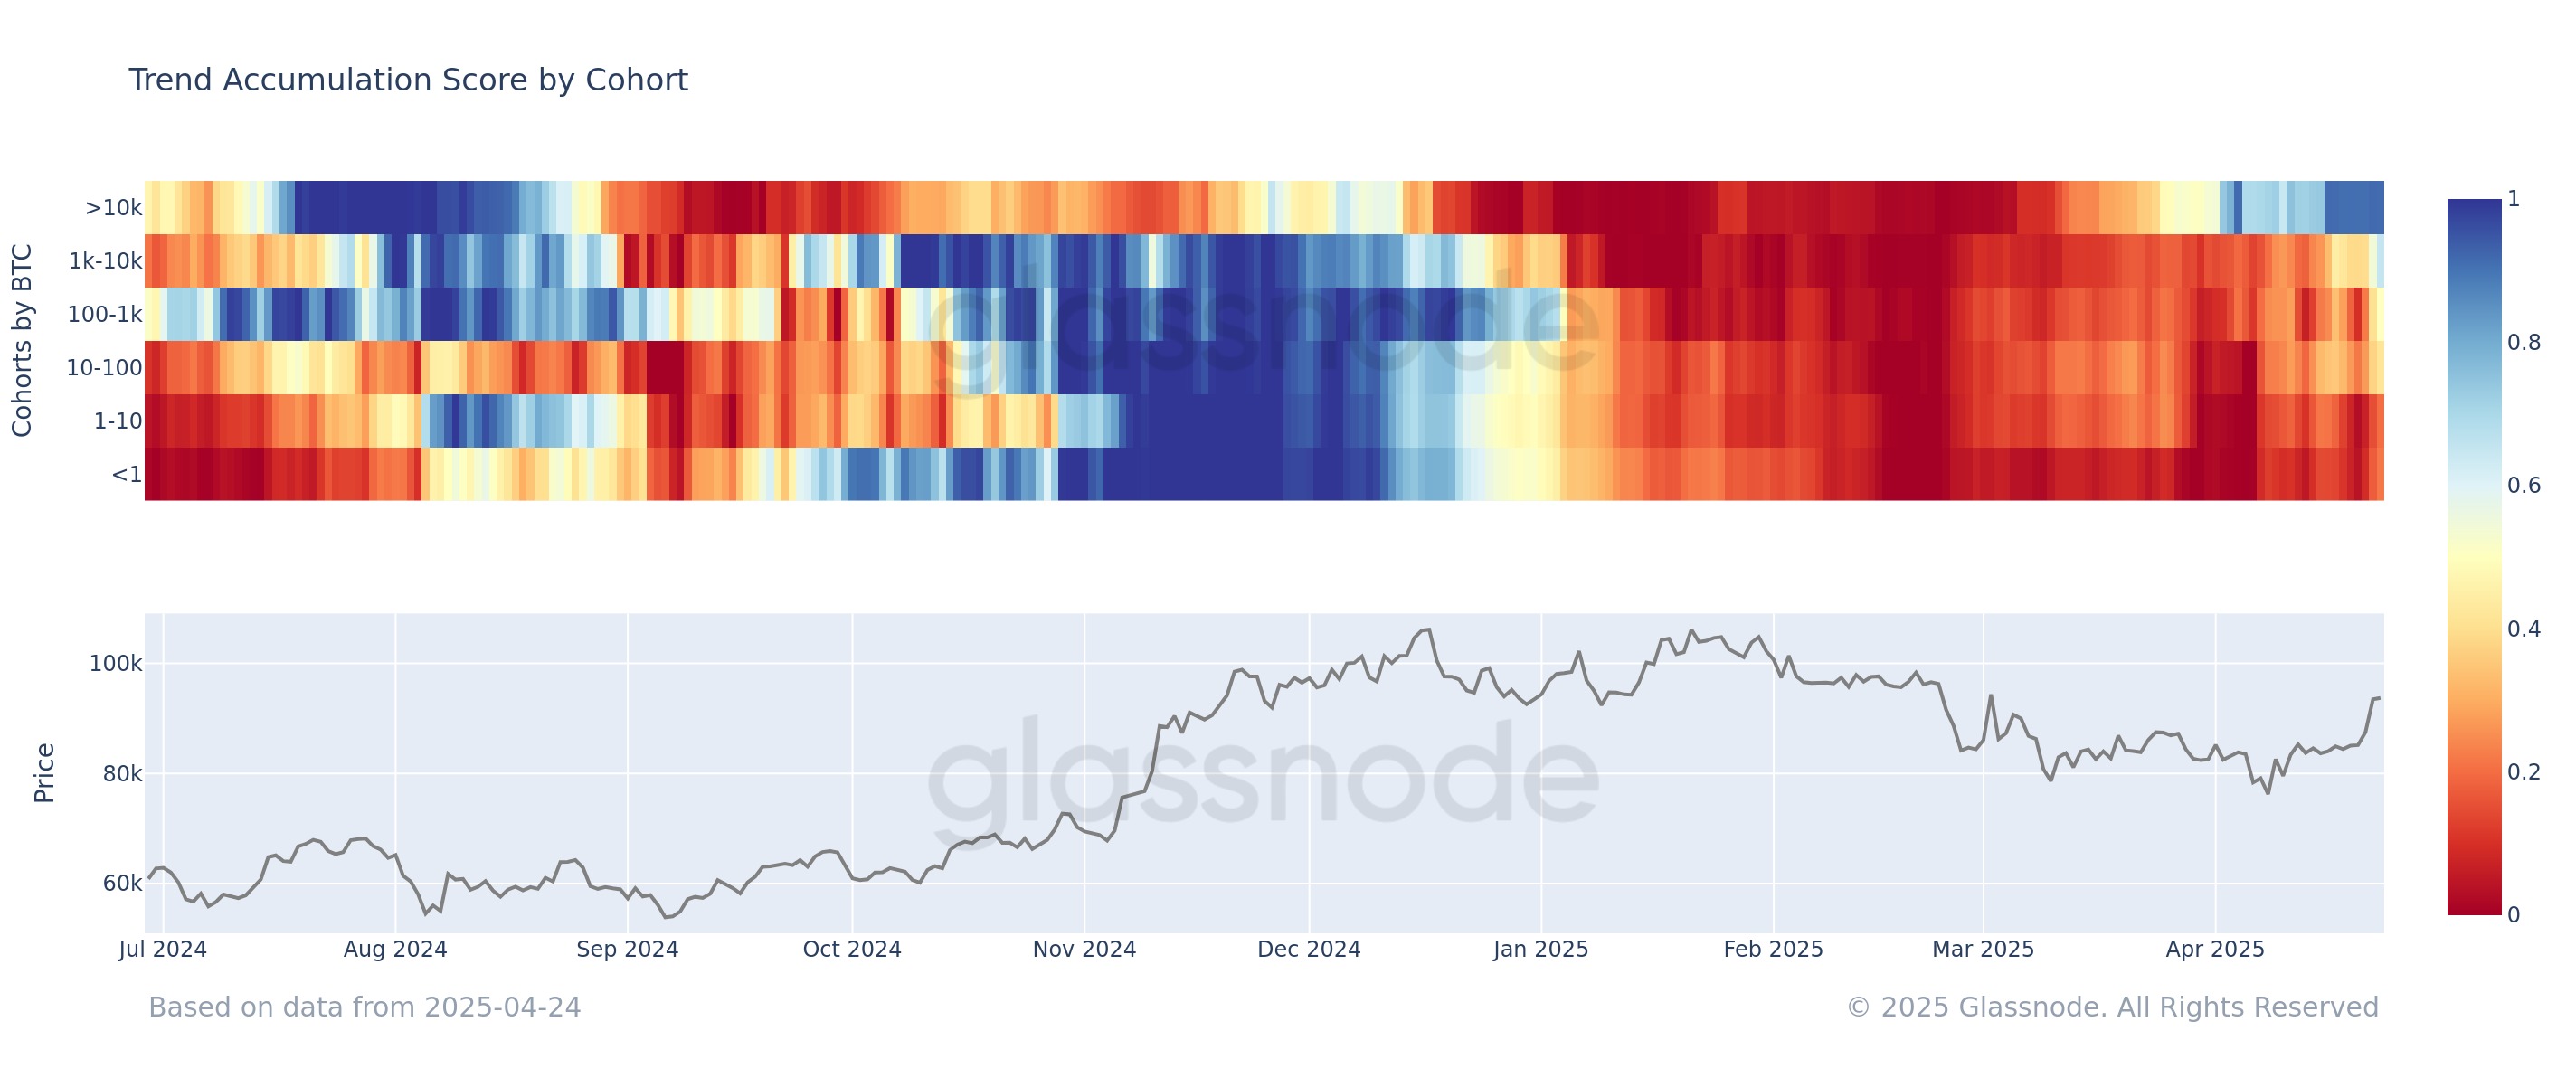
As displayed in the above graph, the Bitcoin market as a whole has been in a state of distribution during the last few months, but one cohort started to pull away from the rest last month: the 10,000+ BTC holders.
The investors holding between 1,000 and 10,000 BTC are popularly known as the whales, so these investors, who are even more humongous, could be termed as the mega whales.
From the chart, it’s visible that the rest of the market continued to sell into this month, but the mega whales, who were already dropping off their distribution, pivoted to buying instead. They have since only strengthened their behavior, with the metric now even reaching a near-perfect score of 0.9.
The whales have also turned things around very recently, as the score has hit 0.7 for them. Thus, it would appear that the big-money investors as a whole have been accumulating Bitcoin during the latest recovery rally.
Among the rest of the market, the sharks (100 to 1,000 BTC) are the closest at catching up to the whales, with their Accumulation Trend Score sitting at 0.5. The investors on the smaller end are still continuing to distribute.
The current pattern is sort of similar to what was witnessed back in December 2024, where the Bitcoin mega whales started participating in strong distribution ahead of the rest.
Bitcoin Price
Bitcoin crossed above the $94,000 level earlier, but it seems the coin has seen a pullback since then as its price is back at $92,600.

