Menu

Categories:

Hot right now:

Follow on:

Coinsurges provides coverage of fintech, blockchain, and Bitcoin, delivering the most recent news and analyses on the future of money. Stay up-to-date with live prices, charts, and trading options for the top exchanges. Keep track of the day's top cryptocurrency gainers and losers, as well as which coins have experienced gains and losses in the past 24 hours.
Trust Coinsurges as your go-to source for all news and updates in the industry.

Bitcoin wrestles with key moving averages and short term holder prices

Share This Post

Quick Take

Bitcoin’s 20% decline from its all-time high has raised concerns about the potential impact on the ongoing bull run.

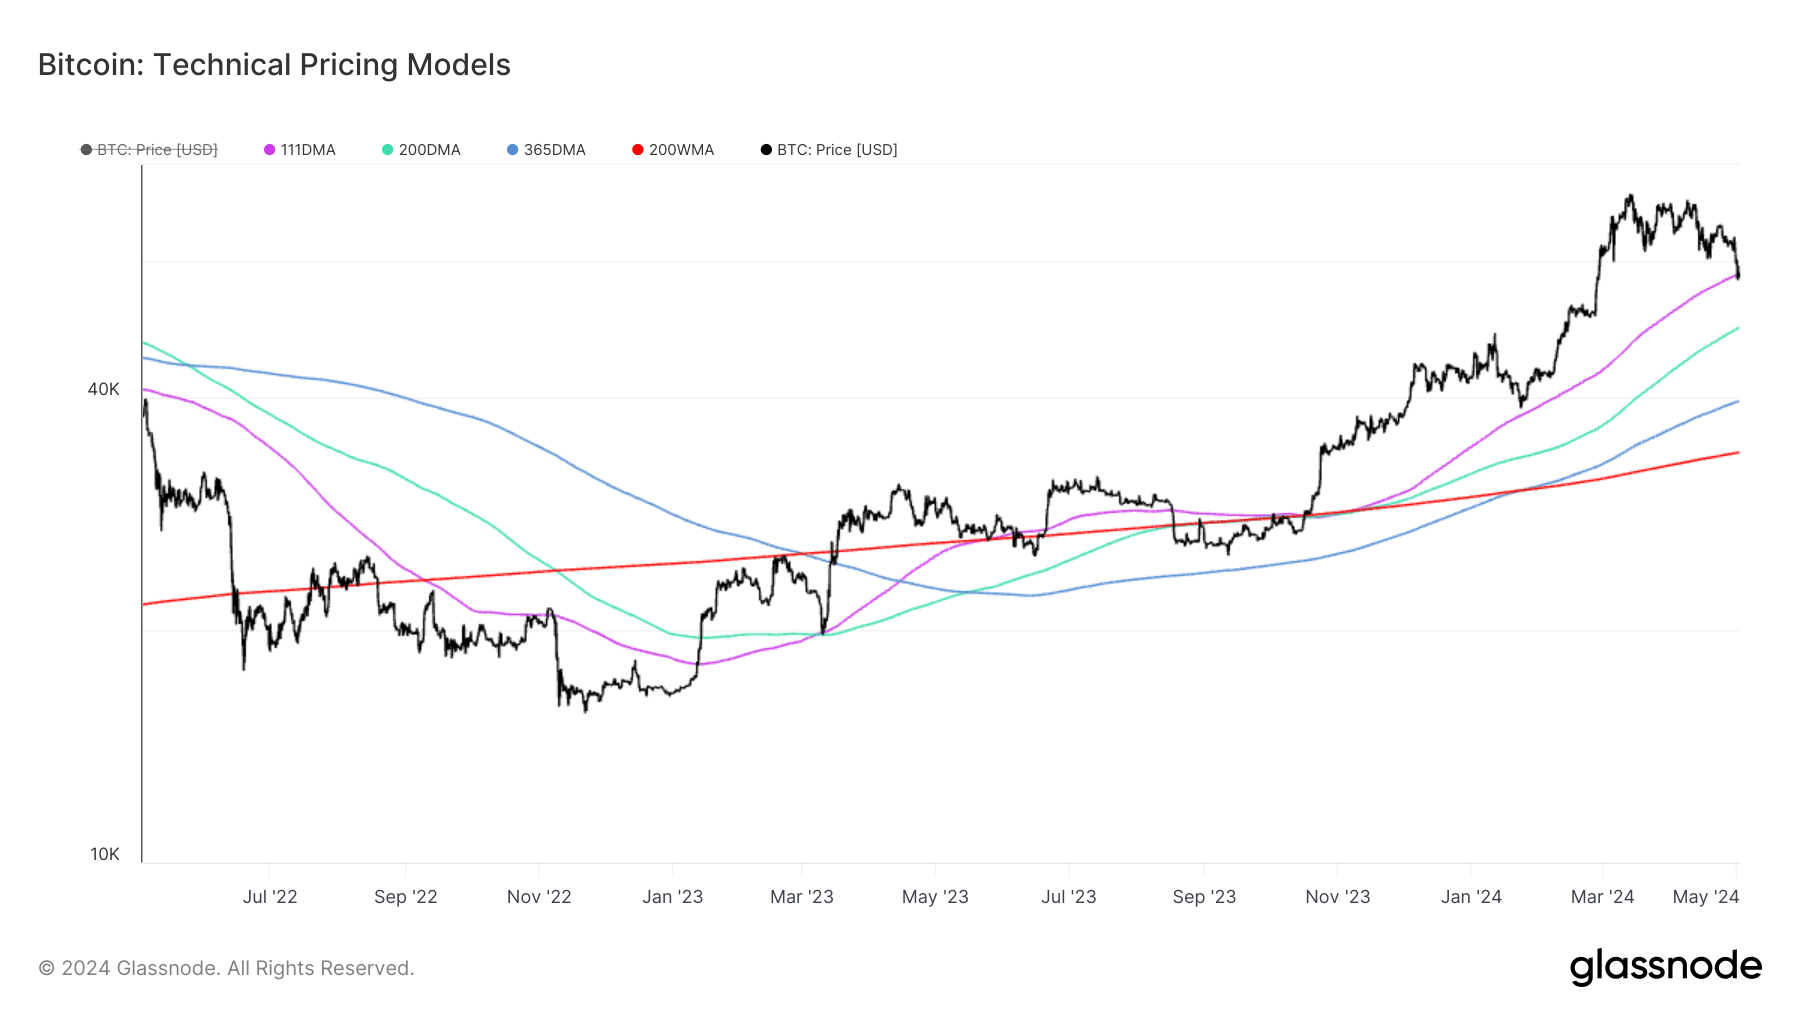
To better understand the current market conditions, we can analyze Bitcoin’s price against key moving averages, widely used technical indicators in the digital asset space. One of the most crucial moving averages is the 111-day moving average (111dma), currently at $57,779. Bitcoin briefly dipped below this level, a scenario that has occurred in previous bull runs, notably in 2017. This moving average has historically been a critical support level during bullish periods.

111 day moving average: (Source: Glassnode)
111-day moving average: (Source: Glassnode)

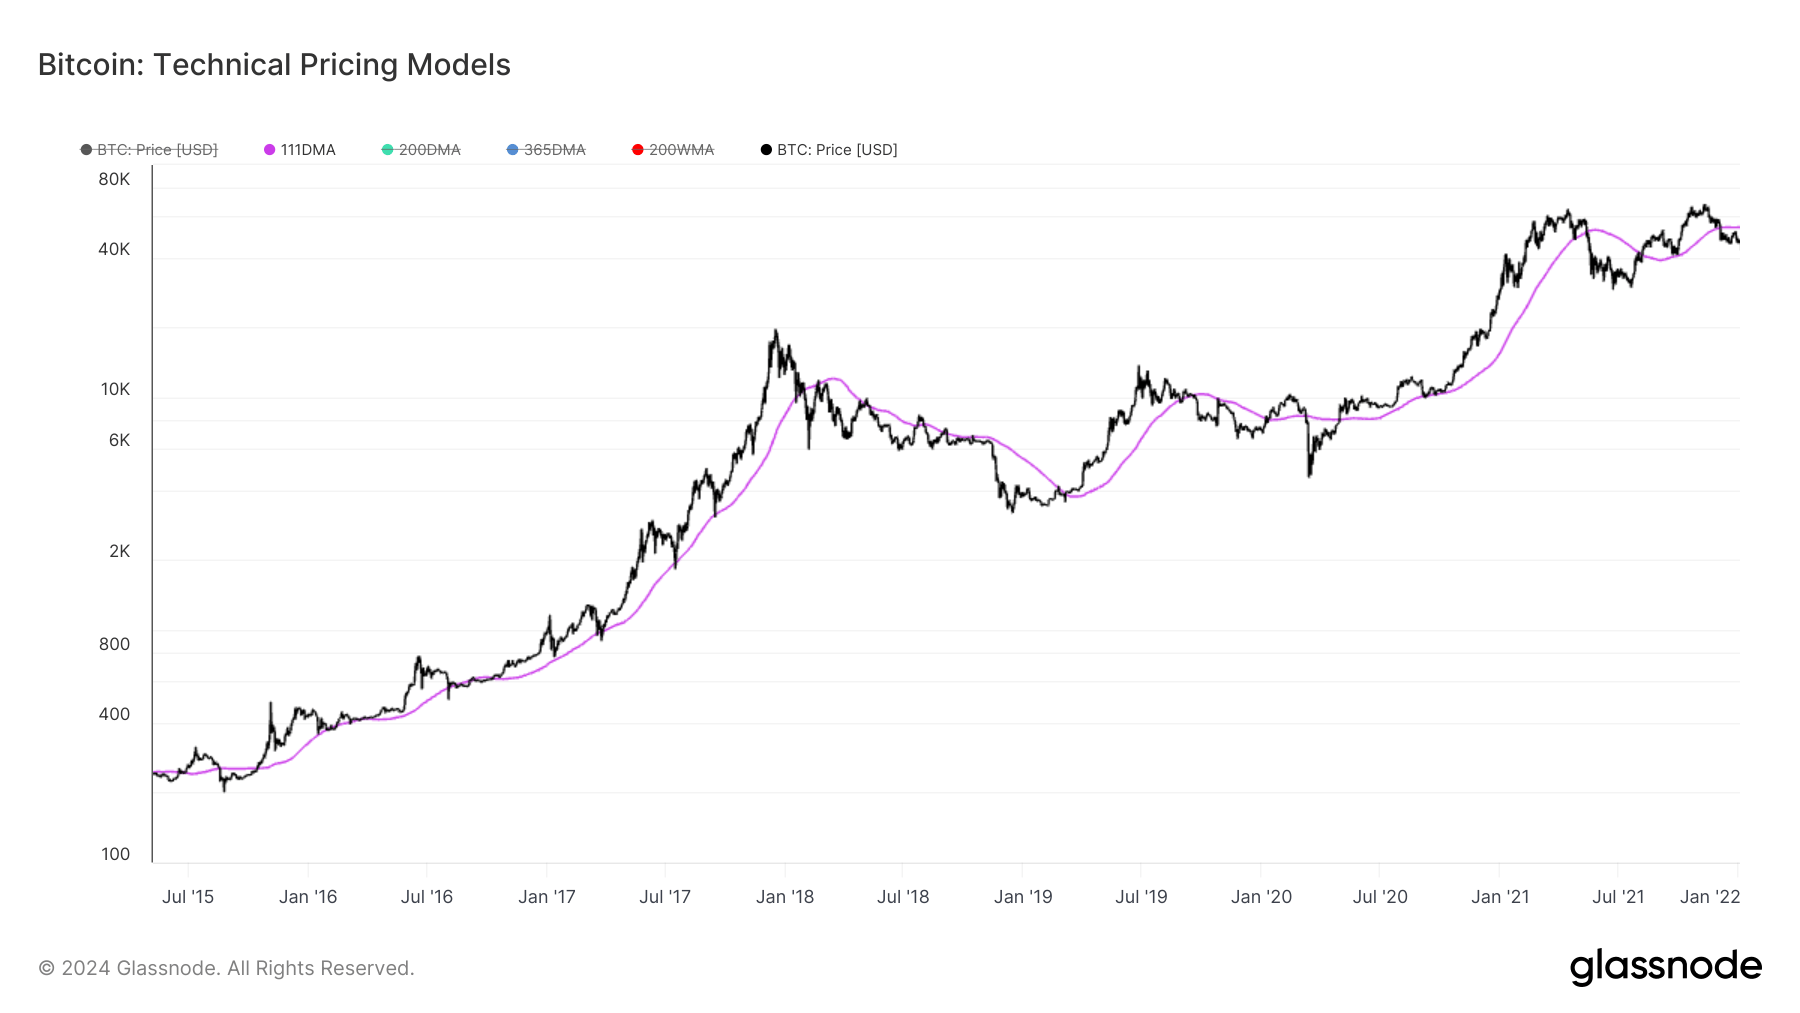
Other key moving averages to watch include the 200-day moving average (200dma) at $49,278, the 365-day simple moving average (365dma) at $39,593, and the 200-week moving average (200wma) at $33,963. Bitcoin must maintain its position above these levels to keep the potential bull run alive.

According to Glassnode data, these moving averages serve different purposes. The Pi Cycle Indicator (111D-SMA) captures short-to-mid-term market momentum, while the Mayer Multiple (200D-SMA) is commonly associated with the transition point between bull and bear markets. The Yearly Moving Average (365D-SMA) provides a long-standing baseline for high time-frame market momentum, and the 200 Week Moving Average (200W-SMA) captures the baseline momentum of a classic four-year Bitcoin cycle.

Technical Pricing Models: (Source: Glassnode)

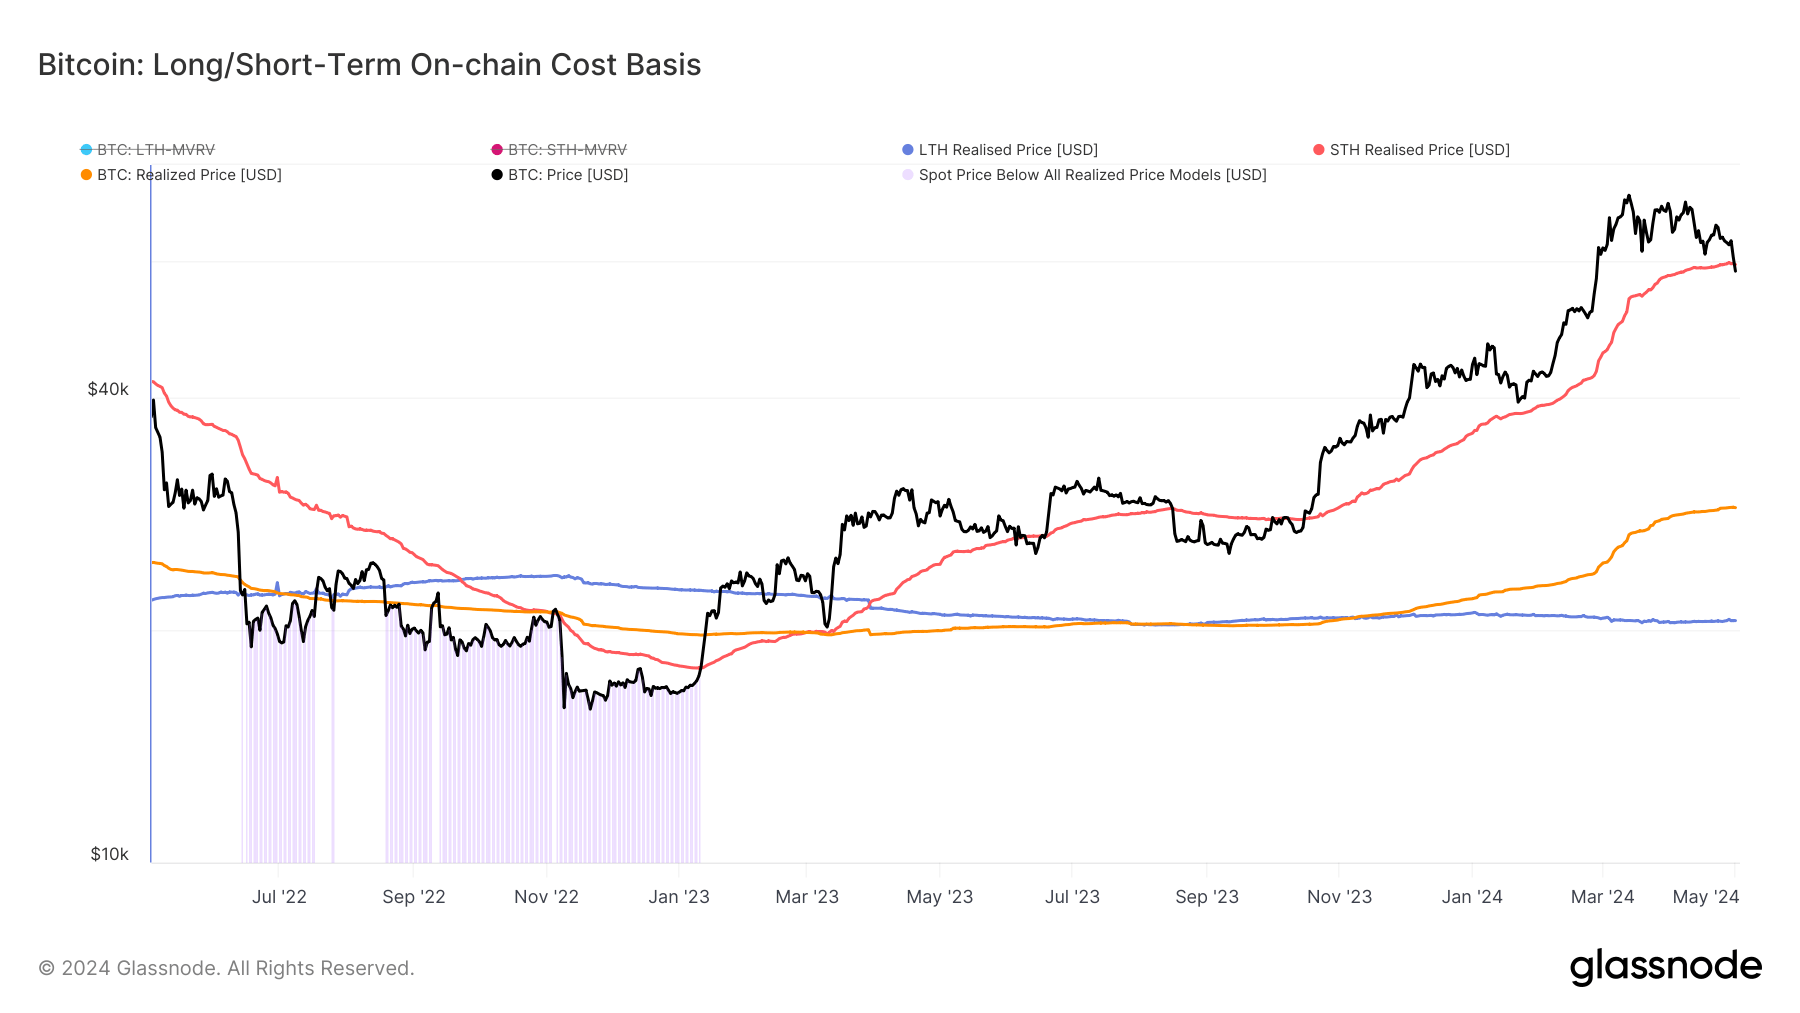
Additionally, Bitcoin has fallen below the short-term holder realized price, currently at $59,468. Reclaiming this level is considered a vital indicator of the digital asset’s potential recovery.

Long/Short-Term On-Chain Cost Basis: (Source: Glassnode)

The post Bitcoin wrestles with key moving averages and short term holder prices appeared first on CryptoSlate.

Read Entire Article
spot_img
- Advertisement -spot_img

Related Posts

Bitcoin’s Last Drawdown To $74,000 A ‘Healthy Correction’ — Analyst Says Bull Cycle Is Still On

The price of Bitcoin has found its way back above the $85,000 mark, marking a huge success in the recovery from the coin’s latest slump toward $74,000 According to an on-chain analyst, this recent

XRP, SOL, and AVAX Buck the Trend in Mixed Week of Crypto Action

The cryptocurrency market slipped by 156% in the past 24 hours on Sunday, pulling the global market cap down to $266 trillion as major assets saw mixed performance Altcoins Diverge as Trading Volume

Bitcoin Price Analysis: Daily Chart Hints at Accumulation While Momentum Divides

Bitcoin traded at $83,681 on April 13, 2025, with a market capitalization of $166 trillion, a 24-hour trading volume of $2601 billion, and an intraday price range between $83,648 and $85,731, as the

Bitcoin Surges Amid Leverage-Driven Price Action – Will It Last?

Bitcoin is now trading above the $85,000 mark following an impressive rally that began on Wednesday after US President Donald Trump announced a 90-day pause on reciprocal tariffs for all countries

XRP Price Watch: Bullish Momentum Builds as XRP Climbs Past $2.17

XRP’s price is currently $217, marking a modest increase against the US dollar in the past 24 hours The cryptocurrency boasts a market capitalization of $126 billion and has seen $374 billion in

Best Meme Coins to Buy as Fartcoin’s 300% Run Early Sign for Returning Risk-on Sentiment in Crypto

In times when the global economy is reeling from the brunt of the ongoing Trump-inflicted trade war, there’s one asset that has outperformed everything It’s Fartcoin ($FARTCOIN), an AI